
Key takeaways:
- With the US economy remaining resilient and central banks cutting rates, it may be too early to call time on the positive run within high yield bonds as companies should begin to find it easier to refinance.
- The upward re-rating in Chinese equities demonstrates how quickly the market can reassess potential in an asset class and we are seeing something similar in the telecoms sector – a previously unloved part of the high yield bond market.
- The yields on offer from high yield bonds should continue to attract investors in a falling rate environment, but with spreads relatively tight investors need to carefully assess the fundamentals of corporate borrowers.
A common refrain amongst the investment community is that with central banks moving to cut rates, inflation must be tamed and economic strength is the new concern. In such an environment, it makes sense to move up in quality within corporate bonds because you will be more exposed to bonds that are more interest rate sensitive and less exposed to credit sensitive assets.
We do not disagree with the central premise of this argument. Where we think it falls down is when it is applied simplistically. One could quite easily have assembled a convincing case for an impending recession in the past 24 months – inverted yield curves, weak purchasing manager indices, subdued consumer confidence – and avoided high yield bonds in their entirety. To do so would have been costly as global high yield bonds, represented by the ICE Global High Yield Bond Index, delivered a total return in US dollars of 31.9% over the 24 months to 30 September 2024.1
High yields offer a head start
Part of that strong return has come from capital gain, but nearly 60% came from income. Time and again, throughout history, it is income that typically drives the long-term returns on assets. Today, US high yield is yielding approximately 7.0% and European high yield 5.8%.2 These are not the most generous yields, but they are not mean either and certainly not in the context of current inflation levels. A cursory glance at the yield on US high yield versus US inflation (headline Consumer Price Index) suggests that current yield levels are about standard for the last 20 years outside the spikes that occur in crises.
Figure 1: Yield on US high yield bonds versus US inflation
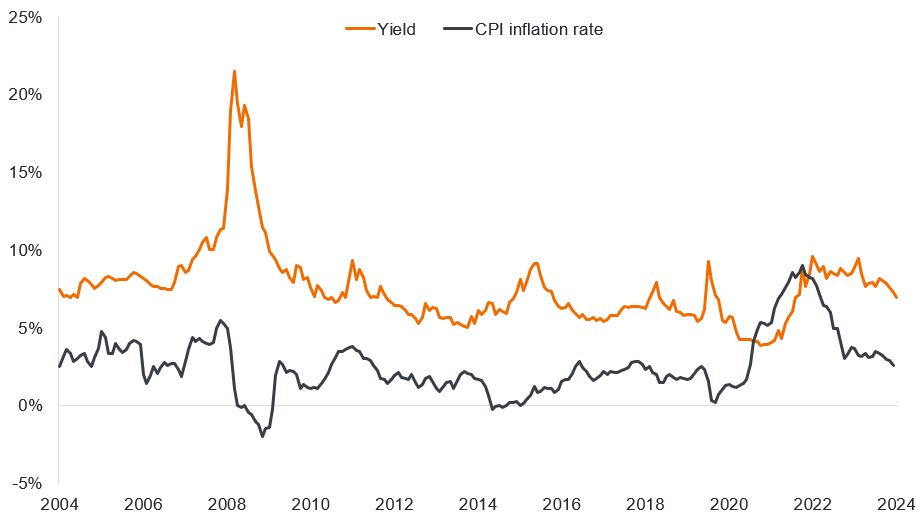
Source: LSEG Datastream, ICE BofA US High Yield Index, yield to worst, Bureau of Labor Statistics, US Consumer Price Index (CPI) inflation rate, year-on year percentage change, seasonally adjusted, 30 September 2004 to 30 September 2024. Yield to worst is the lowest yield a bond (index) can achieve provided the issuer(s) does not default; it takes into account special features such as call options (that give issuers the right to call back, or redeem, a bond at a specified date). Yields may vary over time and are not guaranteed.
Spreads tight but could they go tighter?
It is at the credit spread level that valuations on high yield bonds look rich but just because they are at the tighter (or low) end of their range does not mean they cannot go tighter. As a reminder, the credit spread is the difference in yield between a corporate bond and the equivalent government bond. It is essentially the part of a corporate bond’s yield that reflects the additional compensation investors want to be paid to take on the risk of lending to that company. A soft landing is the type of environment that could allow credit spreads to tighten further, since moderate economic growth should allow cashflows to be maintained and reduces the risk that central banks would revert to raising interest rates again.
Spreads widen when investors demand greater compensation to own bonds. Right now, tight spreads are the market’s way of signalling that investors are reasonably comfortable to accept credit risk (the risk that a corporate borrower is unable to meet their debt repayments). This is evident in bond issuance where the supply of corporate bonds has been met by plenty of demand from investors. In the first nine months of 2024, companies have issued €74billion in non-financial high yield bonds in Europe, up 97% on the same period last year, while in the US some US$235 billion has been issued, up 74%.3 Companies can access markets, and this is helping to keep the default rate relatively low considering we have just come through a tightening cycle.
Spread levels can be thought of as compensation for fundamental risk (risk to corporate cash flows coming either from wider economic growth factors or factors unique to that company) and liquidity risk (ability for a company to refinance, typically influenced by supply/demand for bonds and the environment fostered by central banks).
On the fundamental side, we are getting mixed data. US economic data has been resilient but European purchasing manager indices – which indicate business activity levels – have been moribund.
On the liquidity side, on both sides of the Atlantic, interest rates are coming down. In the US, the most recent figures for the US Federal Reserve’s (Fed’s) preferred inflation measure (Personal Consumption Expenditures) was at 2.2% year-on-year for August 2024 at the headline level (2.7% at the core level that excludes volatile food and energy prices).4 This is close to the Fed’s 2% inflation target, providing the Fed with flexibility to cut rates aggressively if the economy weakens. The Fed’s 50 basis point interest rate cut in September was proof that the Fed is keen to be pro-active in tackling any economic deterioration. With the rate cutting cycle underway, pressure on interest coverage ratios diminishes.
Within Europe, we are seeing a growing proportion of high yield issuers opting for floating rate notes. These are bonds that come with an interest rate that changes (floats) rather than a fixed coupon. The benefit to the issuer is that the rate should fall as central banks cut policy rates. This would allow for a faster transmission of looser monetary policy, and with the European Central Bank considering bringing forward rate cuts the impact could be felt even earlier.
Figure 2: European high yield non-financial senior supply (EUR billion)

Source: Bond radar, Morgan Stanley Research, issuance over last 12 months, September 2012 to September 2024.
Positive re-rating
We said at the beginning that high yield bonds are not universally loved. Investors see attractions from the yield but are wary about tight spread levels. Part of this reflects a preference for rate sensitive assets over credit as well as some de-risking ahead of the US election. In our view, this is good. If favouring high yield over investment grade was popular then the asset class would be more vulnerable to sell-offs. As things stand, high yield is in the bucket that asset allocators view with caution.
The same could have been said about Chinese equities until last month. Chinese equities jumped more than 20% in a matter of days in late September in response to stimulus announcements from the Chinese authorities.5
Something similar has happened within high yield bonds issued by telecommunication (telco) companies. In the past few weeks we have seen merger and acquisition activity in the telcos market, with Verizon bidding for Frontier Communications – a company that essentially reunites Verizon with some of the fibre network assets it sold back in 2017. The pending deal is positive for Frontier bonds that are expected to be refinanced by Verizon, which has a stronger credit rating. Meanwhile within media, DIRECTV has bid for EchoStar’s video distribution business DISH. Concurrently, AT&T is selling its 70% holding in DIRECTV to release money partly to reinvest in fibre connectivity.
The merger and acquisition activity has the potential to create synergies and reduce costs but we think some of this re-rating can be linked to the theme of artificial intelligence (AI) and the increased need for data transfer. Fibre networks are being revalued as a useful transmission tool. What this means is that a high yield company such as fibre network business Lumen, which over-expanded and over-levered its balance sheet, in our view now has considerable growth potential because it has the hard assets of a global fibre network in place.
Whether it is consolidation or a re-evaluation of assets in a business, we are seeing market sentiment towards telco assets, particularly those with fibre businesses, turn more favourable and that has caused spreads to come down and bond prices to rise as yields have fallen sharply in the sector. Over the course of the third quarter of 2024 alone, the telecoms sector of the US high yield market returned 11%.6 Yet yields and spreads remain elevated, which could offer the prospect for further gains.
Figure 3: US high yield telecom sector has performed strongly in recent months
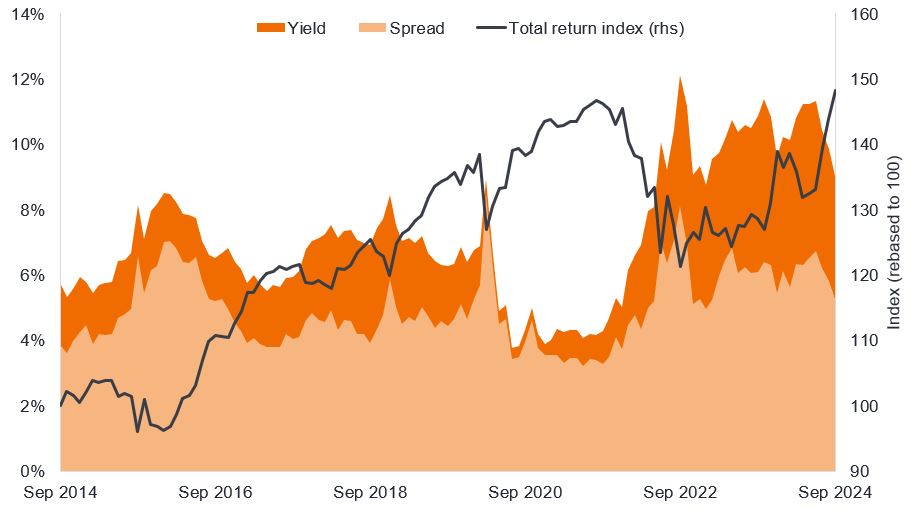
Source: Bloomberg, ICE BofA US High Yield Telecommunications Index, yield to worst, option adjusted spread over governments, total return index in US dollars, September 2014 to September 2024. Yields may vary and are not guaranteed. Past performance does not predict future returns.
Due diligence
Taken together, we think the cautious attitude towards high yield may be misplaced and (putting geopolitics aside) the positive run in high yield can continue so long as the US economy holds up. That does not mean being complacent. We need to be mindful that idiosyncratic risk is ever present and high yield bonds are rated lower quality for a reason. Challenges exist. These challenges can and are being dealt with, which explains the relatively low default rates experienced during the most recent tightening cycle.
Yet we also need to recognise that some bonds will struggle. Among bonds rated CCC, the amount of cash available to cover debt costs is low, with many companies actively burning cash. They can cut capital expenditure (capex) to free up cash to some extent, but even this has negative implications as one company’s saving on capex is another company’s lost revenue.
The tightness in spreads means little room for disappointment so earnings results alongside economic data will command particular importance. For now, economic data continues to point to a soft landing and central bank rate cuts should help to bring down bond yields. High yield bonds typically have shorter maturities than investment grade bonds on average, so a decline in the front end of the yield curve has the potential to help boost total returns and cut refinancing costs.
So far, rate cuts have been in response to falling inflation and as a precautionary measure to ward off economic softness. Provided that remains the case, we think high yield continues to offer attractions within a diversified portfolio.
1Source: Bloomberg, ICE BofA Global High Yield Index, total returns in US dollars, 30 September 2022 to 30 September 2024. Past performance does not predict future returns.
2Source: Bloomberg, ICE BofA US High Yield Index, ICE BofA Euro High Yield Index, 30 September 2024. Yields may vary over time and are not guaranteed.
3Source: Morgan Stanley Research, year to date to 30 September 2024.
4Source: Bureau of Economic Analysis. US Personal Consumption Expenditure, seasonally adjusted, year-on-year percentage change to 31 August 2024.
5Source: LSEG Datastream, MSCI China Index, total return in US dollars, 23 September 2024 to 30 September 2024. Past performance does not predict future returns.
6Source: Bloomberg, ICE BofA US High Yield Telecommunications Index, total return in US dollar from 30 June 2024 to 30 September 2024. Past performance does not predict future returns.
IMPORTANT INFORMATION
Fixed income securities are subject to interest rate, inflation, credit and default risk. The bond market is volatile. As interest rates rise, bond prices usually fall, and vice versa. The return of principal is not guaranteed, and prices may decline if an issuer fails to make timely payments or its credit strength weakens.
High-yield or “junk” bonds involve a greater risk of default and price volatility and can experience sudden and sharp price swings.
Past performance does not predict future returns. There is no guarantee that past trends will continue or forecasts will be realised.
References made to individual securities do not constitute a recommendation to buy, sell or hold any security, investment strategy or market sector, and should not be assumed to be profitable. Janus Henderson Investors, its affiliated advisor, or its employees, may have a position in the securities mentioned.
The ICE BofA Euro High Yield Index tracks EUR denominated below investment grade corporate debt publicly issued in the euro domestic of eurobond markets.
The ICE BofA US High Yield Index tracks US dollar denominated below investment grade corporate debt publicly issued in the US domestic market.
The ICE BofA Global High Yield Index tracks USD, CAD, GBP and EUR denominated below investment grade corporate debt publicly issued in the major domestic or eurobond markets.
The ICE BofA US High Yield Telecommunications Index is a subset of ICE BofA US High Yield Index including all securities of telecommunications issuers.
The MSCI China Index captures large and mid cap representation across Chinese equities.
Basis points: Basis point (bp) equals 1/100 of a percentage point, 1bp = 0.01%.
Call: A callable bond is a bond that can be redeemed (called) early by the issuer prior to the maturity date.
Capital expenditure: Money invested to acquire or upgrade fixed assets such as buildings, machinery, equipment or vehicles in order to maintain or improve operations and foster future growth.
Cash flow: The net amount of cash and cash equivalents transferred in and out of a company.
Corporate bond: A bond issued by a company. Bonds offer a return to investors in the form of periodic payments and the eventual return of the original money invested at issue on the maturity date.
Corporate fundamentals are the underlying factors that contribute to the price of an investment. For a company, this can include the level of debt (leverage) in the company, its ability to generate cash and its ability to service that debt.
Coupon: A regular interest payment that is paid on a bond, described as a percentage of the face value of an investment. For example, if a bond has a face value of $100 and a 5% annual coupon, the bond will pay $5 a year in interest.
Credit rating: A score given by a credit rating agency such as S&P Global Ratings, Moody’s and Fitch on the creditworthiness of a borrower. For example, S&P ranks investment grade bonds from the highest AAA down to BBB and high yields bonds from BB through B down to CCC in terms of declining quality and greater risk, i.e. CCC rated borrowers carry a greater risk of default.
Credit spread is the difference in yield between securities with similar maturity but different credit quality. Widening spreads generally indicate deteriorating creditworthiness of corporate borrowers, and narrowing indicate improving.
Default: The failure of a debtor (such as a bond issuer) to pay interest or to return an original amount loaned when due.
Diversification: A way of spreading risk by mixing different types of assets/asset classes in a portfolio, on the assumption that these assets will behave differently in any given scenario. Please note diversification neither assures a profit nor eliminates the risk of experiencing losses.
Federal Reserve (Fed): The central bank of the US which determines its monetary policy.
High yield bond: Also known as a sub-investment grade bond, or ‘junk’ bond. These bonds usually carry a higher risk of the issuer defaulting on their payments, so they are typically issued with a higher interest rate (coupon) to compensate for the additional risk.
Idiosyncratic risk: Factors that are specific to a particular company.
Inflation: The rate at which prices of goods and services are rising in the economy.The Consumer Price Index is a measure of inflation that examines the price change of a basket of consumer goods and services over time. The Personal Consumption Expenditures Price Index is a measure of prices that people living in the US pay for goods and services.
Interest coverage ratio: This is a measure of a company’s ability to cover its debt payments. It can be calculated by dividing earnings (before interest and taxes) by the interest expense on a company’s outstanding debt.
Investment grade bond: A bond typically issued by governments or companies perceived to have a relatively low risk of defaulting on their payments, reflected in the higher rating given to them by credit ratings agencies.
Issuance: The act of making bonds available to investors by the borrowing (issuing) company, typically through a sale of bonds to the public or financial institutions.
Landing: A hard landing is where the economy contracts sharply. A soft landing is a moderate slowdown in the economy in response to a controlled reduction in inflation.
Leverage: The level of borrowing at a company. Leverage is an interchangeable term for gearing: the ratio of a company’s loan capital (debt) to the value of its ordinary shares (equity); it can also be expressed in other ways such as net debt as a multiple of earnings, typically net debt/EBITDA (earnings before interest, tax, depreciation and amortisation). Higher leverage equates to higher debt levels.
Maturity: The maturity date of a bond is the date when the principal investment (and any final coupon) is paid to investors. Shorter-dated bonds generally mature within 5 years, medium-term bonds within 5 to 10 years, and longer-dated bonds after 10+ years.
Monetary policy: The policies of a central bank, aimed at influencing the level of inflation and growth in an economy. Monetary policy tools include setting interest rates and controlling the supply of money. Monetary stimulus refers to a central bank increasing the supply of money and lowering borrowing costs. Monetary tightening refers to central bank activity aimed at curbing inflation and slowing down growth in the economy by raising interest rates and reducing the supply of money.
Purchasing Managers Indices (PMI) is a survey that acts as a leading insight into the prevailing direction of economic trends, based on the view of managers across different industries.
Refinancing: The process of revising and replacing the terms of an existing borrowing agreement, including replacing debt with new borrowing before or at the time of the debt maturity.
Yield: The level of income on a security over a set period, typically expressed as a percentage rate. For a bond, at its most simple, this is calculated as the coupon payment divided by the current bond price.
Yield curve: A yield curve plots the yields (interest rate) of bonds with equal credit quality but differing maturity dates. Typically bonds with longer maturities have higher yields. An inverted yield curve occurs when short-term yields are higher than long-term yields. A steepening of the yield curve reflects the yield curve becoming steeper from bottom left (lower maturities) up to top right (longer maturities).
Volatility measures risk using the dispersion of returns for a given investment. The rate and extent at which the price of a portfolio, security or index moves up and down.
These are the views of the author at the time of publication and may differ from the views of other individuals/teams at Janus Henderson Investors. References made to individual securities do not constitute a recommendation to buy, sell or hold any security, investment strategy or market sector, and should not be assumed to be profitable. Janus Henderson Investors, its affiliated advisor, or its employees, may have a position in the securities mentioned.
Past performance does not predict future returns. The value of an investment and the income from it can fall as well as rise and you may not get back the amount originally invested.
The information in this article does not qualify as an investment recommendation.
There is no guarantee that past trends will continue, or forecasts will be realised.
Marketing Communication.