Chart to Watch: U.S. corporate credit yields trading at pre-GFC levels
History suggests that the recent 2011-2021 era of ultra-low bond yields was the anomaly, with yields reverting toward more normalized, pre-Global Financial Crisis (GFC) levels. While spreads are trading through their long-term averages, we think they are justified given sound leverage metrics, healthy earnings projections, and lower than average default rates.
3 minute read
Key takeaways:
- Today’s yields on U.S. investment grade and high yield corporate bonds look like a return to normal (in pre-GFC terms), suggesting the 2011-2021 era of ultra-low bond yields was the anomaly.
- Yields in line with long-term averages provide an attractive investment opportunity, but relatively tight spreads have investors asking whether it’s worth the cost.
- We believe the answer is “yes” when considering absolute yield levels and a shift in Federal Reserve policy serving to ease access to capital and potentially extend the credit cycle. Low leverage, strong interest coverage ratios, healthy earnings projections, and lower-than-average default rates further support our view that spreads can remain range bound in the months ahead.
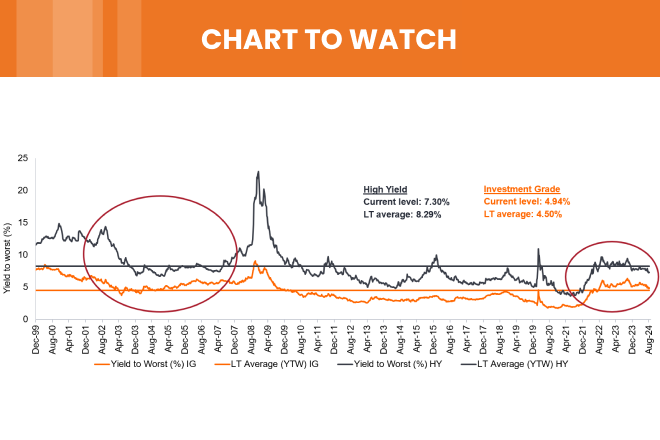
Return to normal: U.S. corporate bond yields back to pre-GFC levels
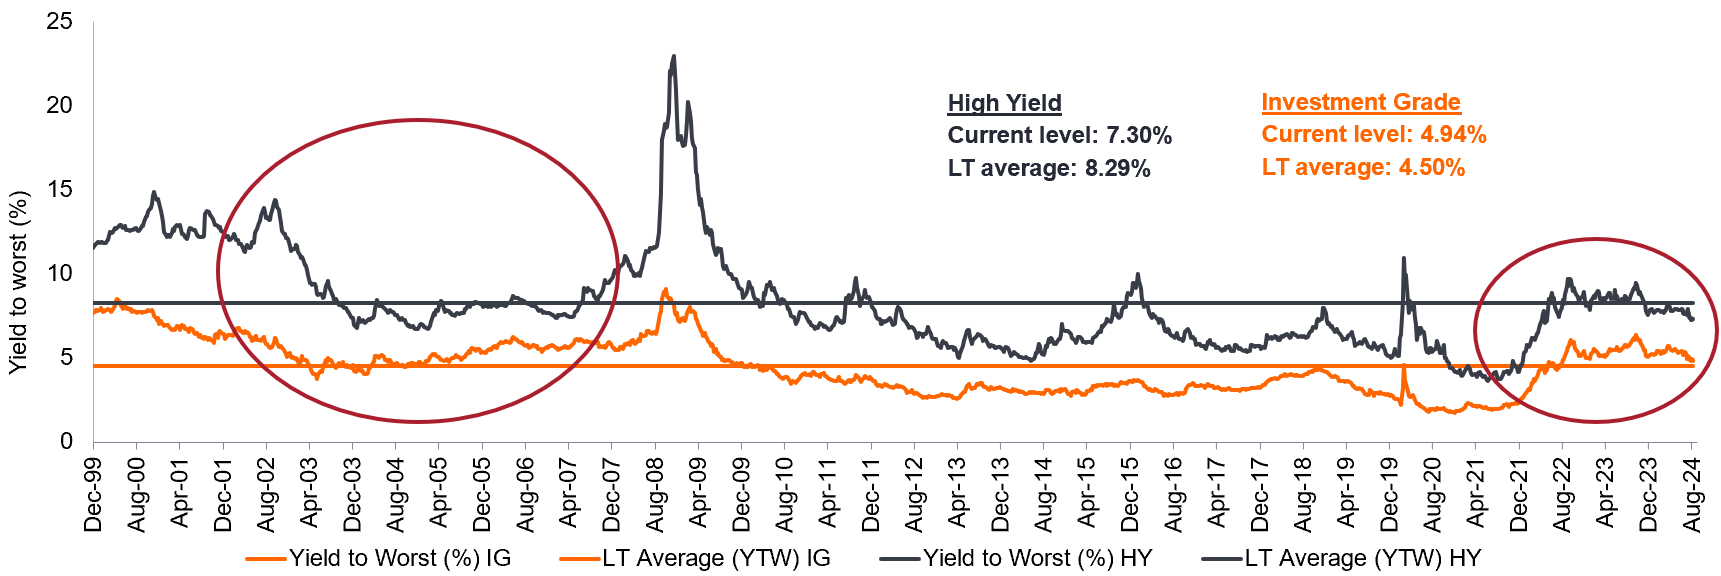
Source: Bloomberg, as at 31 August 2024. “Investment Grade” represents the Bloomberg U.S. Corporate Bond Index, “High Yield” represents the Bloomberg U.S. Corporate High Yield Index. Yields may vary and are not guaranteed. Past performance does not predict future returns.
When comparing historical yields from 2000 to present, today’s U.S. investment-grade corporate bond yields are in the 57th percentile. At 4.8%, the current yield-to-worst on the Bloomberg US Corporate Bond Index has surpassed its long-term average of 4.5%. We see a similar picture in yields on U.S. high yield, which at 7.3%, sit at the 41st percentile and hover near the long-term average of 8.3%. While these yields are compelling, they are on offer at relatively tight spreads, with investment grade corporate spreads in the 22nd percentile and high yield in the 13th percentile.
This signals, to us, a need to remain active and selective, in an environment where we expect heightened dispersion between winners and losers. Of note, however, are the tailwinds from a dovish Federal Reserve (Fed), which has already served to ease access to capital as seen in the recent surge of new issuance. This is accompanied by a largely positive fundamental picture for corporate credit, suggesting that those spreads are justified, with room to go tighter.
The fundamental picture:
- Leverage on balance sheets (as measured by last-12-months debt to earnings before interest, taxes, depreciation, and amortization) sits below the 16-year average at around 4x.
- Interest coverage ratios are nearly as strong as their long-term average of 3.6x and will only strengthen with rates coming down as the Fed continues its rate cutting cycle.
- The U.S. high-yield default rate is rising but off extremely low levels. At 1.78%, it is still relatively benign and well below the long-term average of 3.80%.
- Company earnings projections remain healthy and have room to wobble given a dovish Fed.
I’m bullish credit because the Fed is at our backs and corporate fundamentals remain healthy. It feels like it’s time to lean in and take advantage of the yields on offer, but selectively so. From here, it will be important to find a manager that knows how to identify and buy good yield. – Seth Meyer, Global Head of Client Portfolio Management
The Chart to Watch series highlights data trends that matter. Our investment teams provide insight on what these mean for investors.
IMPORTANT INFORMATION
Fixed income securities are subject to interest rate, inflation, credit and default risk. The bond market is volatile. As interest rates rise, bond prices usually fall, and vice versa. The return of principal is not guaranteed, and prices may decline if an issuer fails to make timely payments or its credit strength weakens.
High-yield or “junk” bonds involve a greater risk of default and price volatility and can experience sudden and sharp price swings.
Past performance does not predict future returns. There is no guarantee that past trends will continue, or forecasts will be realized.
Balance sheet: A financial statement that summarises a company’s assets, liabilities and shareholders’ equity at a particular point in time. Each segment gives investors an idea as to what the company owns and owes, as well as the amount invested by shareholders. It is called a balance sheet because of the accounting equation: assets = liabilities + shareholders’ equity.
Bloomberg U.S. Corporate Bond Index measures the investment grade, US dollar-denominated, fixed-rate, taxable corporate bond market.
Bloomberg U.S. Corporate High Yield Index measures the US dollar-denominated, high yield, fixed-rate corporate bond market.
Corporate bond: A bond issued by a company. Bonds offer a return to investors in the form of periodic payments and the eventual return of the original money invested at issue on the maturity date.
Debt to earnings ratio: Is a financial metric used by lenders to determine borrowing risk. The ratio represents the total amount of debt owed compared to the total amount of earned.
Default: The failure of a debtor (such as a bond issuer) to pay interest or to return an original amount loaned when due.
Fundamentals: Information that contributes to the valuation of a security, such as a company’s earnings or the evaluation of its management team, as well as wider economic factors.
Interest coverage ratio (ICR): a financial metric that measures a company’s ability to pay interest on its debt.
Investment-grade credit: A bond typically issued by governments or companies perceived to have a relatively low risk of defaulting on their payments, reflected in the higher rating given to them by credit ratings agencies.
Leverage: Leverage is also an interchangeable term for gearing: the ratio of a company’s loan capital (debt) to the value of its ordinary shares (equity); it can also be expressed in other ways such as net debt as a multiple of earnings, typically net debt/EBITDA (earnings before interest, tax, depreciation and amortisation). Higher leverage equates to higher debt levels.
Monetary policy: The policies of a central bank, aimed at influencing the level of inflation and growth in an economy. Monetary policy tools include setting interest rates and controlling the supply of money. Dovish policy refers to a central bank increasing the supply of money and lowering borrowing costs.
Spread/Credit Spread is the difference in yield between securities with similar maturity but different credit quality. Widening spreads generally indicate deteriorating creditworthiness of corporate borrowers, and narrowing indicate improving.
Yield: The level of income on a security over a set period, typically expressed as a percentage rate. For a bond, this is calculated as the coupon payment divided by the current bond price. For investment trusts: Calculated by dividing the current financial year’s dividends per share (this will include prospective dividends) by the current price per share, then multiplying by 100 to arrive at a percentage figure.
Yield to worst (YTW) is the lowest yield a bond can achieve provided the issuer does not default and accounts for any applicable call feature (ie, the issuer can call the bond back at a date specified in advance). At a portfolio level, this statistic represents the weighted average YTW for all the underlying issues.
These are the views of the author at the time of publication and may differ from the views of other individuals/teams at Janus Henderson Investors. References made to individual securities do not constitute a recommendation to buy, sell or hold any security, investment strategy or market sector, and should not be assumed to be profitable. Janus Henderson Investors, its affiliated advisor, or its employees, may have a position in the securities mentioned.
Past performance does not predict future returns. The value of an investment and the income from it can fall as well as rise and you may not get back the amount originally invested.
The information in this article does not qualify as an investment recommendation.
There is no guarantee that past trends will continue, or forecasts will be realised.
Marketing Communication.
3 minute read
Key takeaways:
- Today’s yields on U.S. investment grade and high yield corporate bonds look like a return to normal (in pre-GFC terms), suggesting the 2011-2021 era of ultra-low bond yields was the anomaly.
- Yields in line with long-term averages provide an attractive investment opportunity, but relatively tight spreads have investors asking whether it’s worth the cost.
- We believe the answer is “yes” when considering absolute yield levels and a shift in Federal Reserve policy serving to ease access to capital and potentially extend the credit cycle. Low leverage, strong interest coverage ratios, healthy earnings projections, and lower-than-average default rates further support our view that spreads can remain range bound in the months ahead.
Related insights


