Targeting the “worst 60”
In a significant development on “liberation day”, new tariffs were introduced that surpassed initial expectations. Effective from 5th April, a baseline universal tariff of 10% has been set, with additional targeted “reciprocal” tariffs on the “worst 60” trading partners coming into effect on 9th April. These tariffs, ranging from 10-50%, primarily aim to drive down the US trade deficits with each country. This layered tariff structure has brought the average tariff rate to around 22-23%, as seen in the 1890s.
Figure 1: Reciprocal tariff on top 30 trading partners
| US discounted reciprocal tariffs (%) | US discounted reciprocal tariffs (%) | ||
| China | 34 | Israel | 17 |
| Vietnam | 46 | EU | 20 |
| Thailand | 36 | Costa Rica | 10 |
| Taiwan | 32 | Singapore | 10 |
| Switzerland | 31 | Australia | 10 |
| Indonesia | 32 | El Salvador | 10 |
| Pakistan | 29 | Dom Republic | 10 |
| South Africa | 30 | Peru | 10 |
| South Korea | 25 | Colombia | 10 |
| Kazakhstan | 27 | Chile | 10 |
| Malaysia | 24 | UK | 10 |
| Japan | 24 | Turkey | 10 |
| India | 26 | Argentina | 10 |
| Jordan | 20 | Brazil | 10 |
| Philippines | 17 | Egypt | 10 |
Source: JP Morgan, White House, World Bank WITS, USTR, PwC, Tax Foundation, USITC, 3rd April 2025.
An uneven impact across EMs
Such measures underscore the advantages of diversifying investments through the Emerging Market Debt (EMD HC) asset class, discussed in our recent piece “EMD HC resilience underappreciated due to emerging market (EM) label”. Comprised of 69 countries [1], this asset class offers a broad spectrum of opportunities, mitigating the risks of concentrated impacts from such tariffs. As the diverse country composition allows for smaller individual exposures, it enhances the overall resilience of investment portfolios against market volatility.
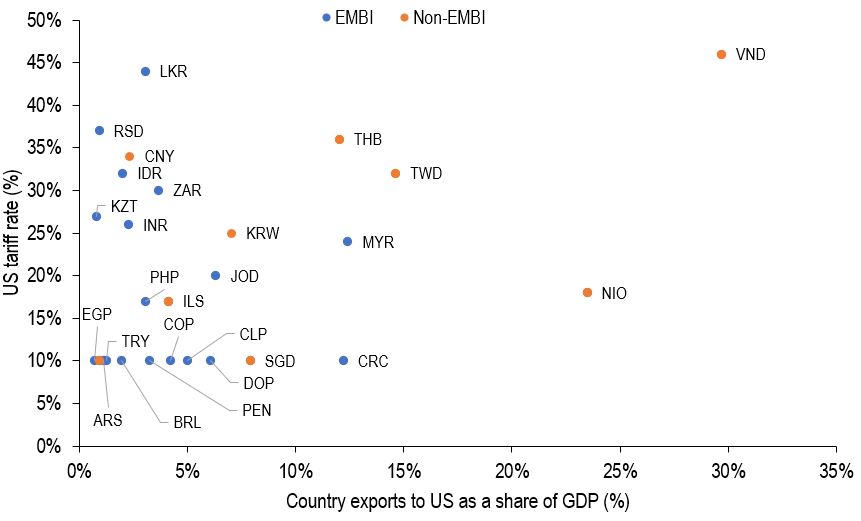
In Figure 2 below, other than Costa Rica and Malaysia, no country in the JP Morgan EMBI Global Diversified Index currently exports more than 10% of their GDP to the US, with most exporting much less.
Figure 2: Country export versus US reciprocal tariff

Source: JP Morgan, Haver Analytics, US Census Bureau, White House, 3rd April 2025.
Horizontal axis: Country exports to US (12m rolling sum, US$bn) as a share of national GDP (4Q rolling sum, US$bn); %; Vertical axis: US discounted reciprocal tariff rate announced by President Trump on 2 April; %. Countries are represented by their currency. LKR: Sri Lanka Rupee; RSD: Serbian Dinar; CNY: Chinese Yuan; IDR: Indonesian Rupiah; ZAR: South African Rand; KZT: Kazakhstani Tenge; INR: Indian Rupee; KRW: South Korean Won; MYR: Malaysian Tinggit; VND: Vietnamese Dong; THB: Thai Baht; TWD: New Taiwan Dollar; NIO: Nicaraguan Córdoba; JOD: Jordanian Dinar; PHP: Philippine Peso; ILS: Israeli New Shekel; EGP: Egyptian Pound; TRY: Turkish Lira; COP: Colombian Peso; CLP: Chilean Peso; CRC: Costa Rican Colón; SGD: Singapore Dollar; DOP: Dominican Peso; BRL: Brazilian Real; PEN: Peruvian Nuevo Sol; ARS: Argentine Peso.
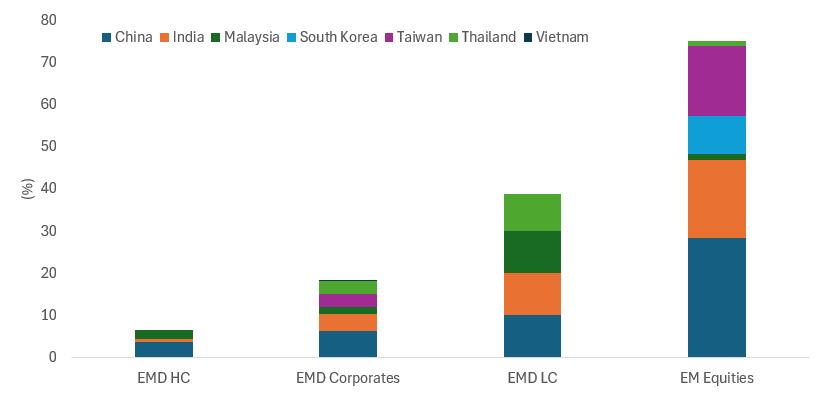
Of the hardest hit EM countries, Vietnam, Thailand, Taiwan, China, and South Korea, play a larger role in the equity and local currency (LC) debt of EMs and frontier markets than in the hard currency benchmark (Figure 3).
Figure 3: Key country exposures in EM and frontier markets debt and equity indices

Source: JP Morgan, Bloomberg, MSCI, as at 31 March 2025. EMD HC: JPM EMBI Global Diversified; EMD corporates: JPM CEMBI Index; EMD LC: JPM GBI-EM Index; EM equities: MSCI EM Equity Index.
While the direct tariff impact seems less severe for EMD HC, what is of more concern are secondary effects such as changes in risk sentiment, falling commodity prices, and a Chinese economic slowdown. These factors influence EMD credit spreads, given the primary driver of sovereign spreads is volatility and risk sentiment. Although we have seen some relief with the weakening of the US dollar, spreads could face widening pressure in the near term. However, we expect underlying US Treasury yields to act as a buffer to such sovereign spread moves, as evidenced when the tariffs were announced, helping to mitigate the impact on returns.
Monitoring the evolving economic landscape and adjusting investment strategies as necessary to balance opportunity and risk will be crucial in navigating these changes effectively. As we continue to monitor these developments, the benefit of investing in EMD HC remains where the diversity and country diversification of the asset class provides better resilience than one might expect.
Footnotes
[1] JPM EMBI GD, as at 31 March 2025.
These are the views of the author at the time of publication and may differ from the views of other individuals/teams at Janus Henderson Investors. References made to individual securities do not constitute a recommendation to buy, sell or hold any security, investment strategy or market sector, and should not be assumed to be profitable. Janus Henderson Investors, its affiliated advisor, or its employees, may have a position in the securities mentioned.
Past performance does not predict future returns. The value of an investment and the income from it can fall as well as rise and you may not get back the amount originally invested.
The information in this article does not qualify as an investment recommendation.
There is no guarantee that past trends will continue, or forecasts will be realised.
Marketing Communication.