Do AAA CLOs still make sense in a declining rate environment?
Portfolio Managers John Kerschner, Nick Childs, and Jessica Shill discuss why they believe the strategic case for AAA CLOs remains compelling amid Federal Reserve (Fed) rate cuts.


9 minute read
Key takeaways:
- With the economy and inflation cooling and the prospect of interest rate cuts on the horizon, some investors may be questioning whether to maintain an allocation to short-duration fixed income within multi-sector allocations.
- We believe investors should remain diversified within their fixed income portfolios throughout the interest rate cycle, with short duration being a key component of a well-rounded portfolio.
- Optimizing total return for one’s entire portfolio is vital to improving long-term risk-adjusted returns. As such, we believe a strategic allocation to AAA CLOs remains a key element of a strategic fixed income allocation.
On the back of recent cooling in economic growth, an uptick in unemployment, and moderating inflation, the Federal Reserve (Fed) looks set to begin its rate-cutting cycle at its September meeting.
Futures markets are anticipating more than 200 basis points (bps) of rate cuts over the next 12 months, bringing the lower bound of the federal funds rate back under 3.25%, from the current 5.25%. Expectations are for the central bank’s benchmark rate to settle around 3.00% through 2026 and into 2027.
With the prospect of declining interest rates, investors may be asking the following questions:
Should I rotate out of short duration into long-duration bonds? If I do maintain an allocation to short duration, which sectors might best suit my investment goals? Should high-quality, floating-rate bonds still command a strategic allocation in my fixed income portfolio?
Why maintain an allocation to short duration through a rate-cutting cycle?
Historically, most of the move down in long-term yields has taken place before the Fed starts cutting, not after (i.e., long-term yields generally move in anticipation of rate cuts). The current cycle is no exception, with the 10-year U.S. Treasury yield rallying to around 3.87% in August 2024, from 4.99% in October 2023.
While long-term yields could rally further, the market is anticipating they will not do so unless we enter a recession. As shown in Exhibit 1, the expectation is that short-term yields will fall over the next two years, with little change to 10-year and 30-year Treasury yields.
Exhibit 1: U.S. Treasury yield curves (actual vs. forecast)
Short-term yields are expected to come down, with little change to the long end.
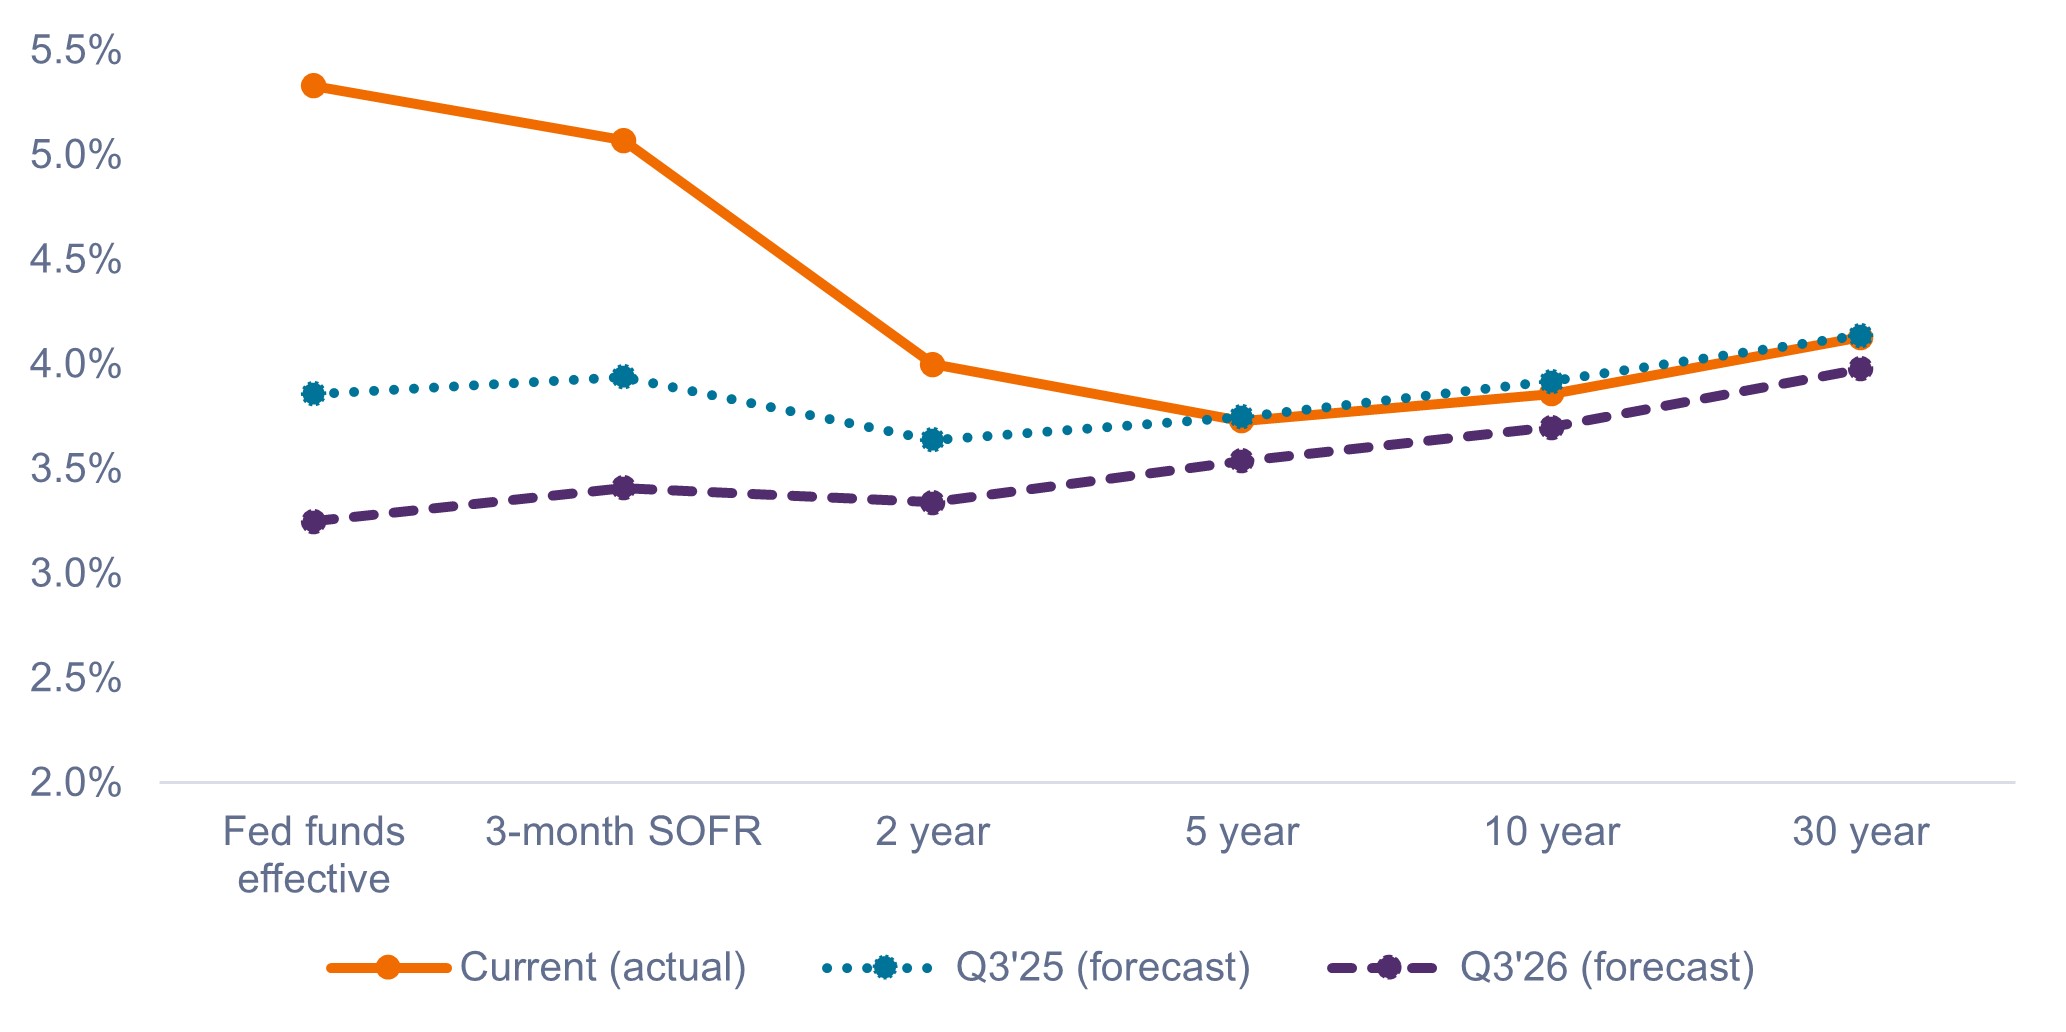 Source: Bloomberg, as of 22 August 2024. Yield curve forecasts based on Bloomberg consensus forecasts.
What does this mean for investors?
- We believe investors should not indiscriminately rotate from short- to long-duration bonds simply because rate cuts are imminent. Investors who do so may be disappointed if long-term yields do not decline as much as they’d hoped. Maintaining an allocation to short duration adds diversification, while also providing a buffer in case rates do not fall as quickly as the market anticipates.
- We believe investors should continue to lean into the attractive yields at the front end of the yield curve. As shown in Exhibit 1, because short-term yields are presently so much higher than long-term yields, even following the anticipated rate cuts, the yield curve is expected to end up flat (i.e., short-term yields at similar levels to those on the long end).
- Investors who are concerned about a recession might complement their short-duration holdings with a long-duration asset that carries virtually no credit risk – such as agency mortgage-backed securities (MBS) – to provide some portfolio defense.
What options do investors have for filling their short-duration bucket?
As rates have moved higher in recent years, investors have flocked to short-duration corporate bonds or cash/money market funds to fill their short-duration bucket. But while the yields are enticing, we believe these sectors may not be the optimal choice for long-term investors seeking better risk-adjusted returns.
According to our analysis, investors will likely be better served with an allocation to AAA rated collateralized loan obligations (CLOs), for the following reasons.
1. Spread return matters, especially when rates go lower
AAA CLOs have historically paid a higher credit spread – or additional income above the risk-free rate – than short-duration investment-grade (IG) corporates and cash. On average, between August 2014 and August 2024, AAA CLOs paid an additional 144 bps over the risk-free rate, compared to 70 bps for short-duration IG corporates and 0 bps for cash/money market funds.
As shown in Exhibit 2, these spread differences might appear less significant when rates are hovering around their multi-decade highs. However, when rates start to decline, the additional income paid by AAA CLOs will become a greater proportion of the total yield and will also help investors to continue to receive an income stream even if rates hypothetically go to zero.
In contrast, cash and money market funds pay nothing when rates go to zero, leaving investors without an income stream from their short-duration holdings.
Exhibit 2: Yield to worst comparison (Aug 2014 – Aug 2024)
Higher spreads equate to higher yields over the long term.
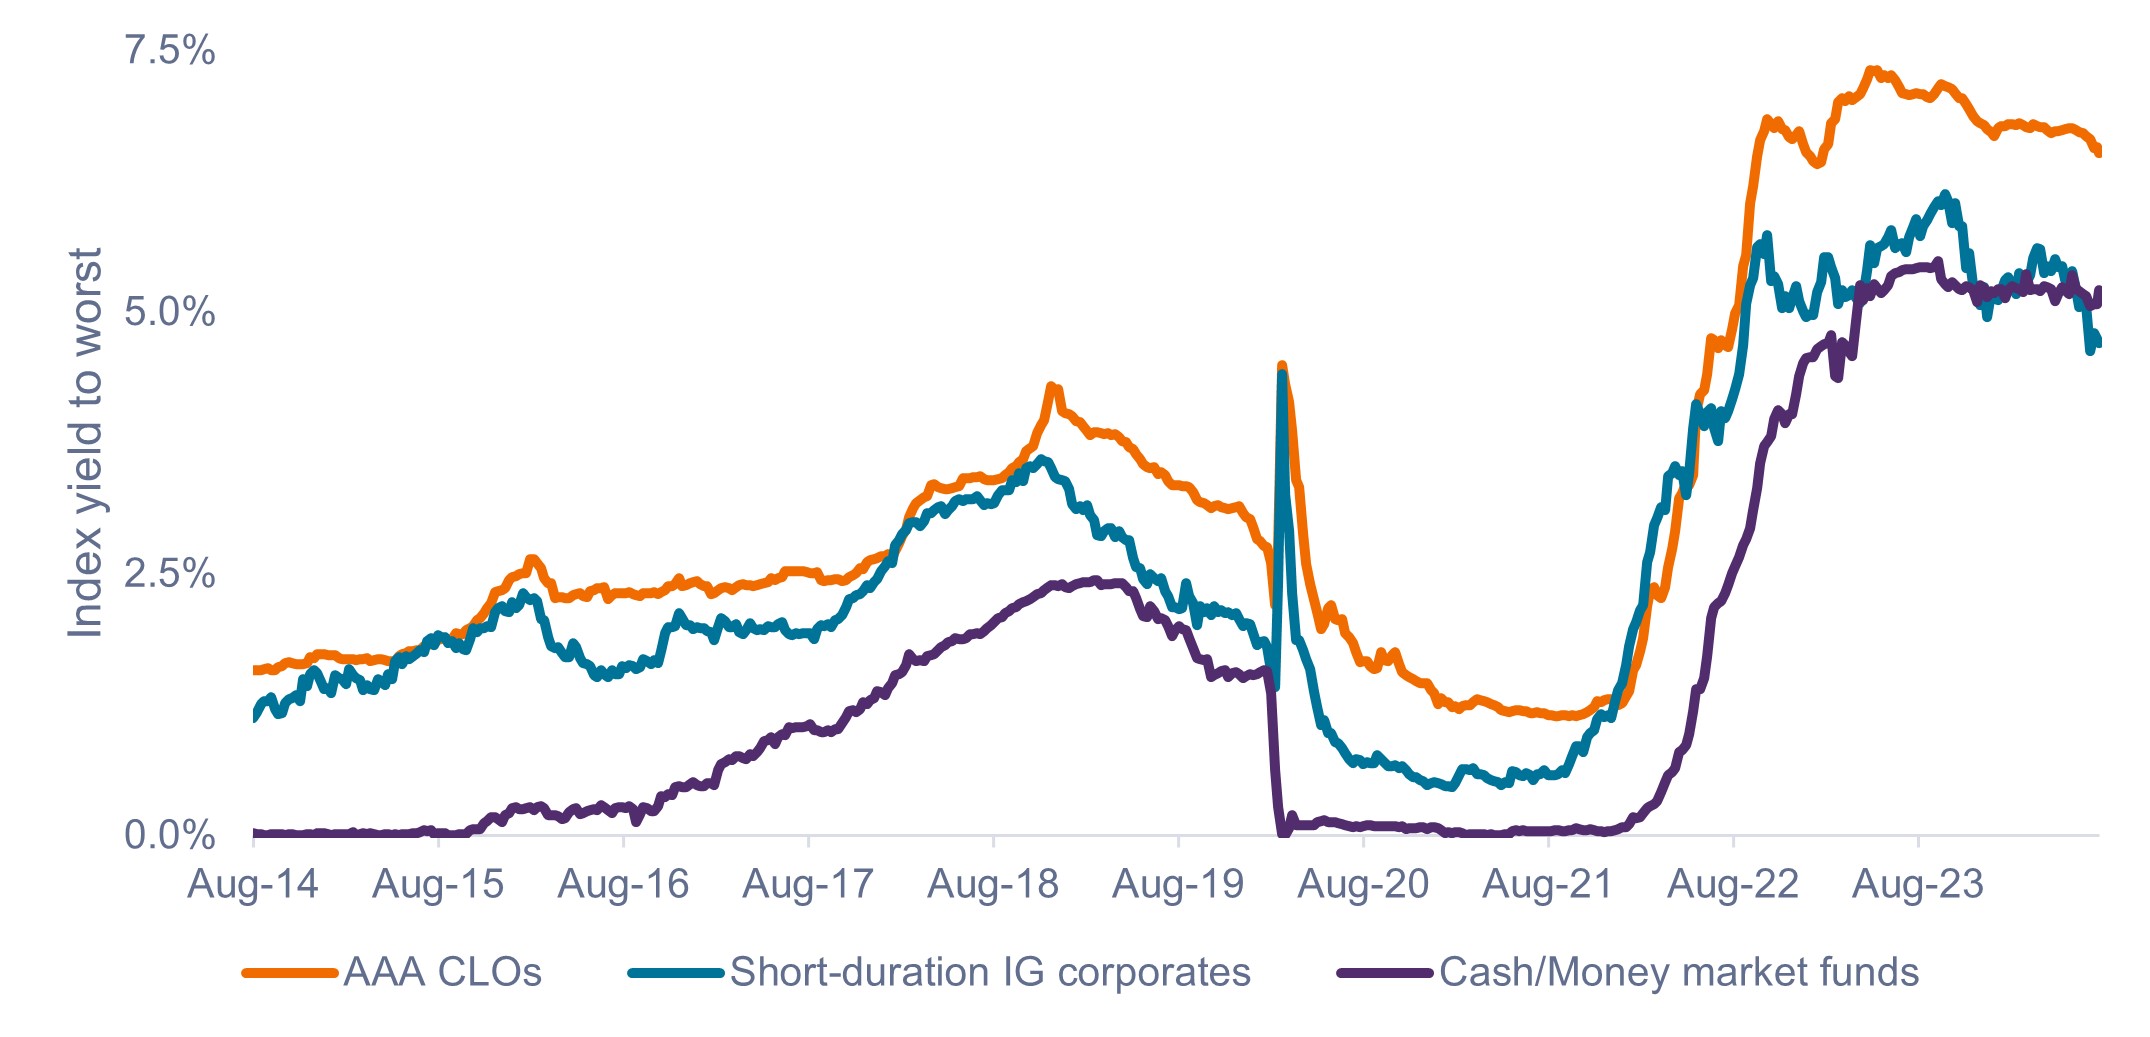 Source: Bloomberg, as of 23 August 2024. Indices used to represent asset classes: AAA CLOs = J.P. Morgan CLO AAA Index, Short-duration IG corporates = Bloomberg U.S. Corporate 1-3 Year Index, Cash / Money market funds = Bloomberg U.S. Treasury Bills: 1-3 Months Index. Yield to worst on AAA CLOs calculated using 3-month LIBOR/SOFR plus J.P. Morgan CLO AAA Discount Margin. Past performance does not predict future returns.
As shown in Exhibit 3, the additional credit spread paid by AAA CLOs has translated into higher cumulative total returns versus short-duration IG corporates and cash.
Exhibit 3: Cumulative growth of an initial $10,000 investment (Aug 2014 – Jul 2024)
Excess returns from credit spread add up over time.
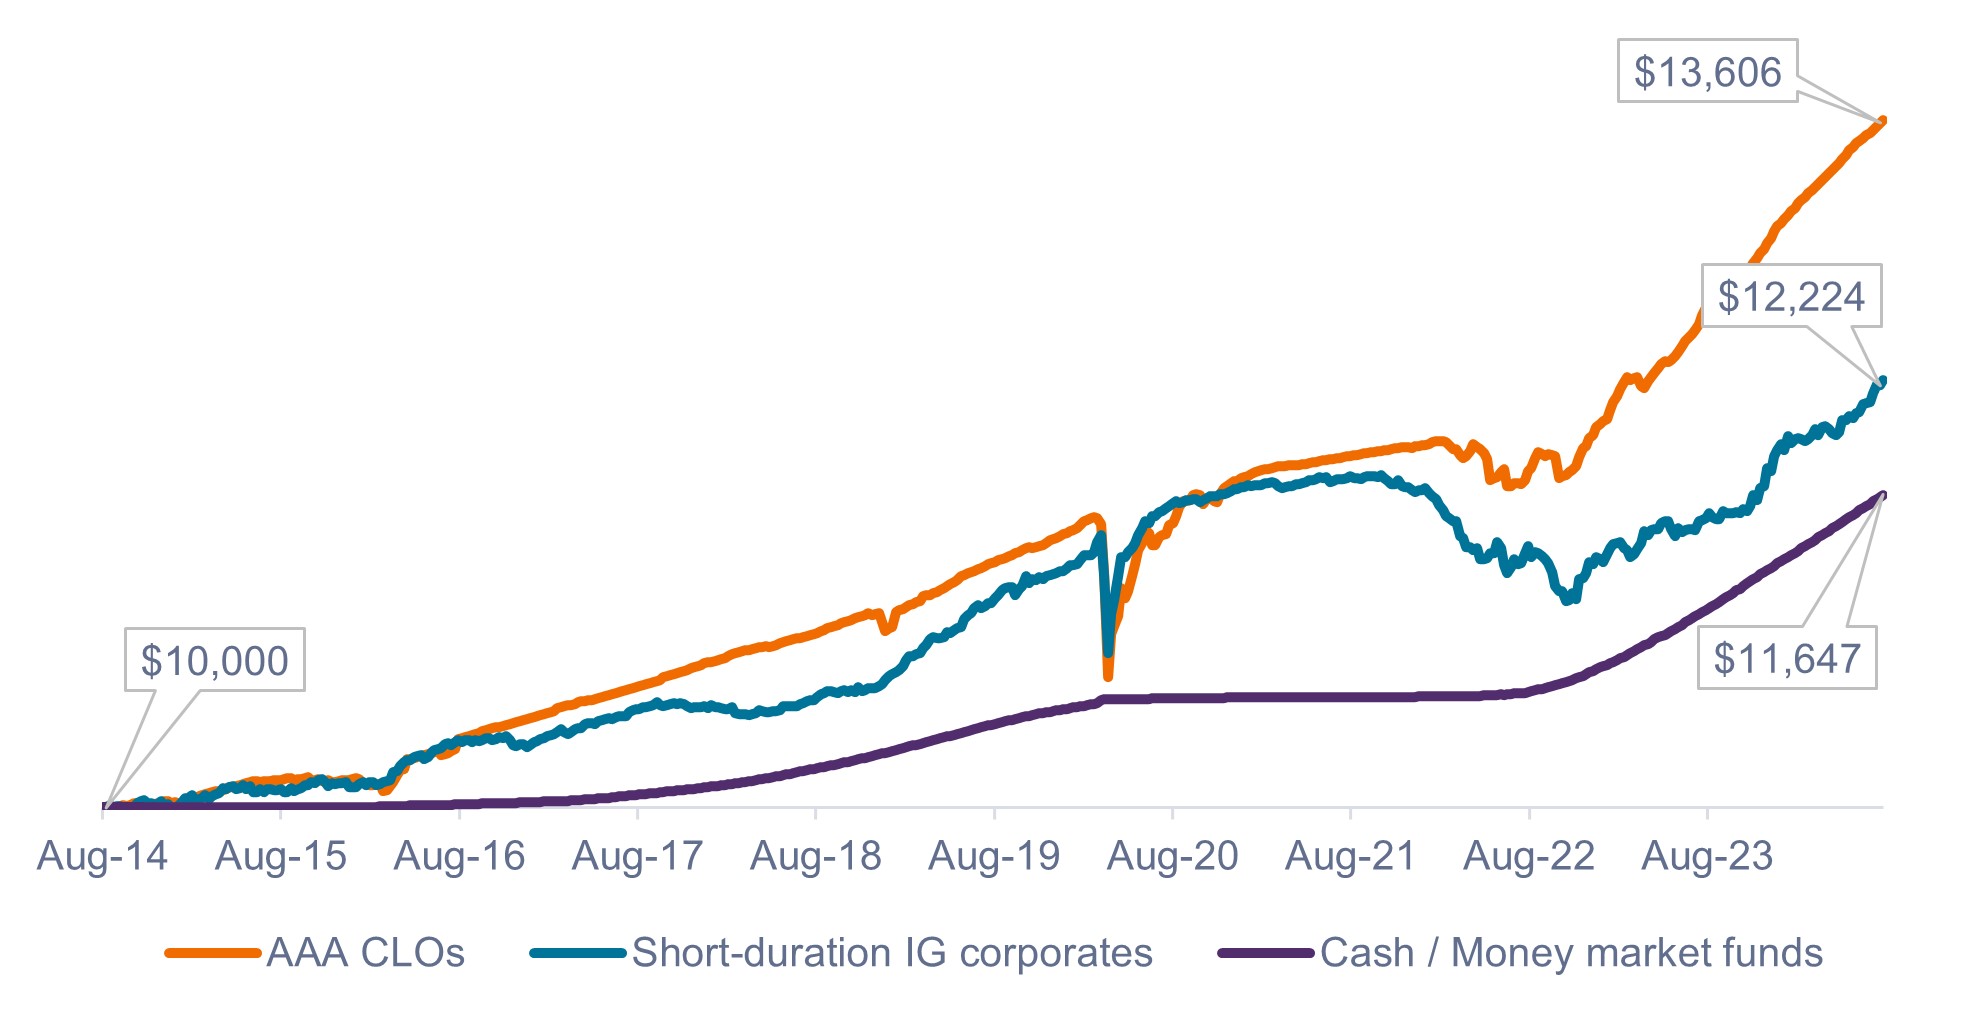 Source: Bloomberg, as of 31 July 2024. Indices used to represent asst classes as per Exhibit 2. Past performance does not predict future results.
2. Higher yields need not come at the cost of lower credit quality
At an index level, AAA CLOs exhibit higher credit quality than short-duration IG corporates. Investors may increase yield while also improving the overall credit quality of their portfolios by incorporating an allocation to AAA CLOs.
Exhibit 4: Index-level average credit ratings
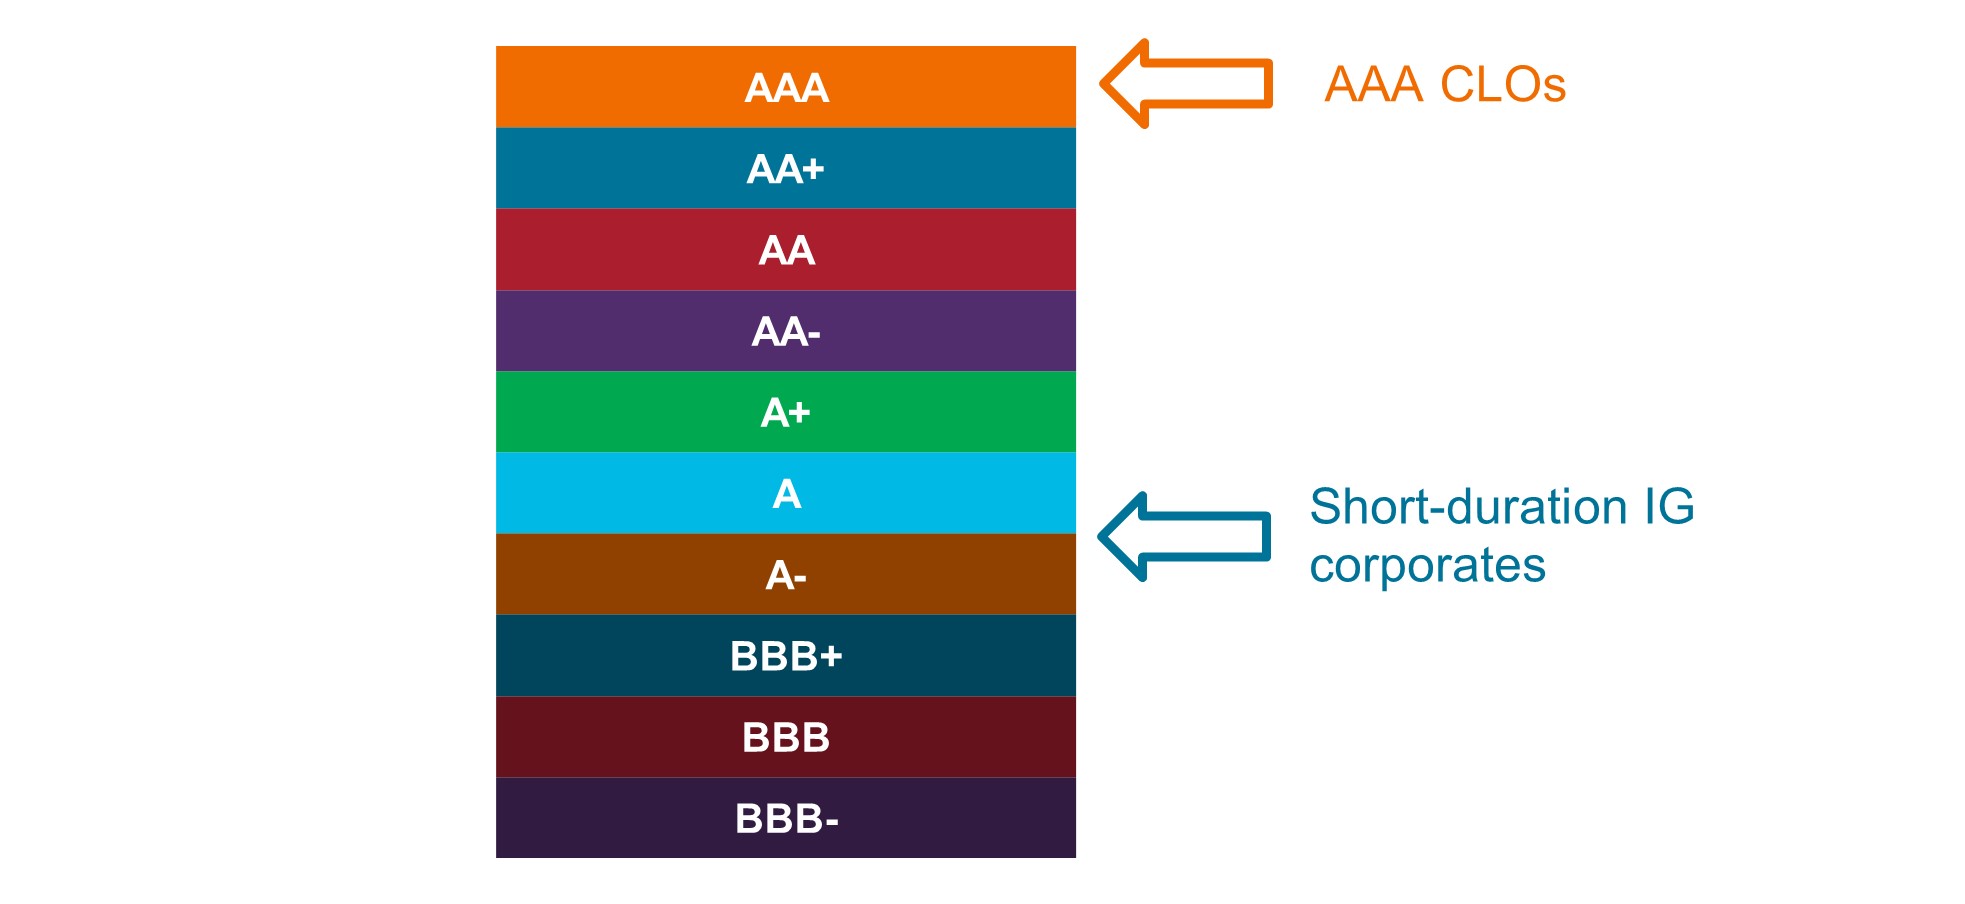 Source: Bloomberg, S&P Ratings, as of 22 August 2024.
3. The precedent of 2019’s rate-cutting cycle
In our view, investors who remain concerned about short duration in a declining rate environment may find it helpful to compare today’s environment to the second half of 2019 – the most recent rate-cutting environment.
The Fed made three rate cuts of 25 bps each during the second half of 2019, taking its benchmark rate from 2.5% to 1.75% by year end. (The Fed subsequently cut rates to zero in March 2020 with the onset of COVID-19).
At that time, the yield curve was slightly inverted (3-month versus 10-year inversion peaked at -51 bps) and Fed rate cuts resulted in the curve flattening out. Today, we also anticipate the yield curve to flatten out, but it is more heavily inverted at -128 bps (3-month yields are 128 bps higher than 10-year yields), which, in our view, makes floating-rate even more appealing than in 2019.
As shown in Exhibit 5, AAA CLOs continued to generate consistent positive returns amid these rate cuts. Once again, despite the downtrend in rates, the credit spread within AAA CLOs supported ongoing income returns.
While short-duration IG corporates marginally outperformed AAA CLOs during that period, they did so with far higher volatility.
Exhibit 5: Total returns during the last Fed rate-cutting cycle (Jun 2019 – Dec 2019)
Credit spread income underpinned continued positive returns despite rate cuts.
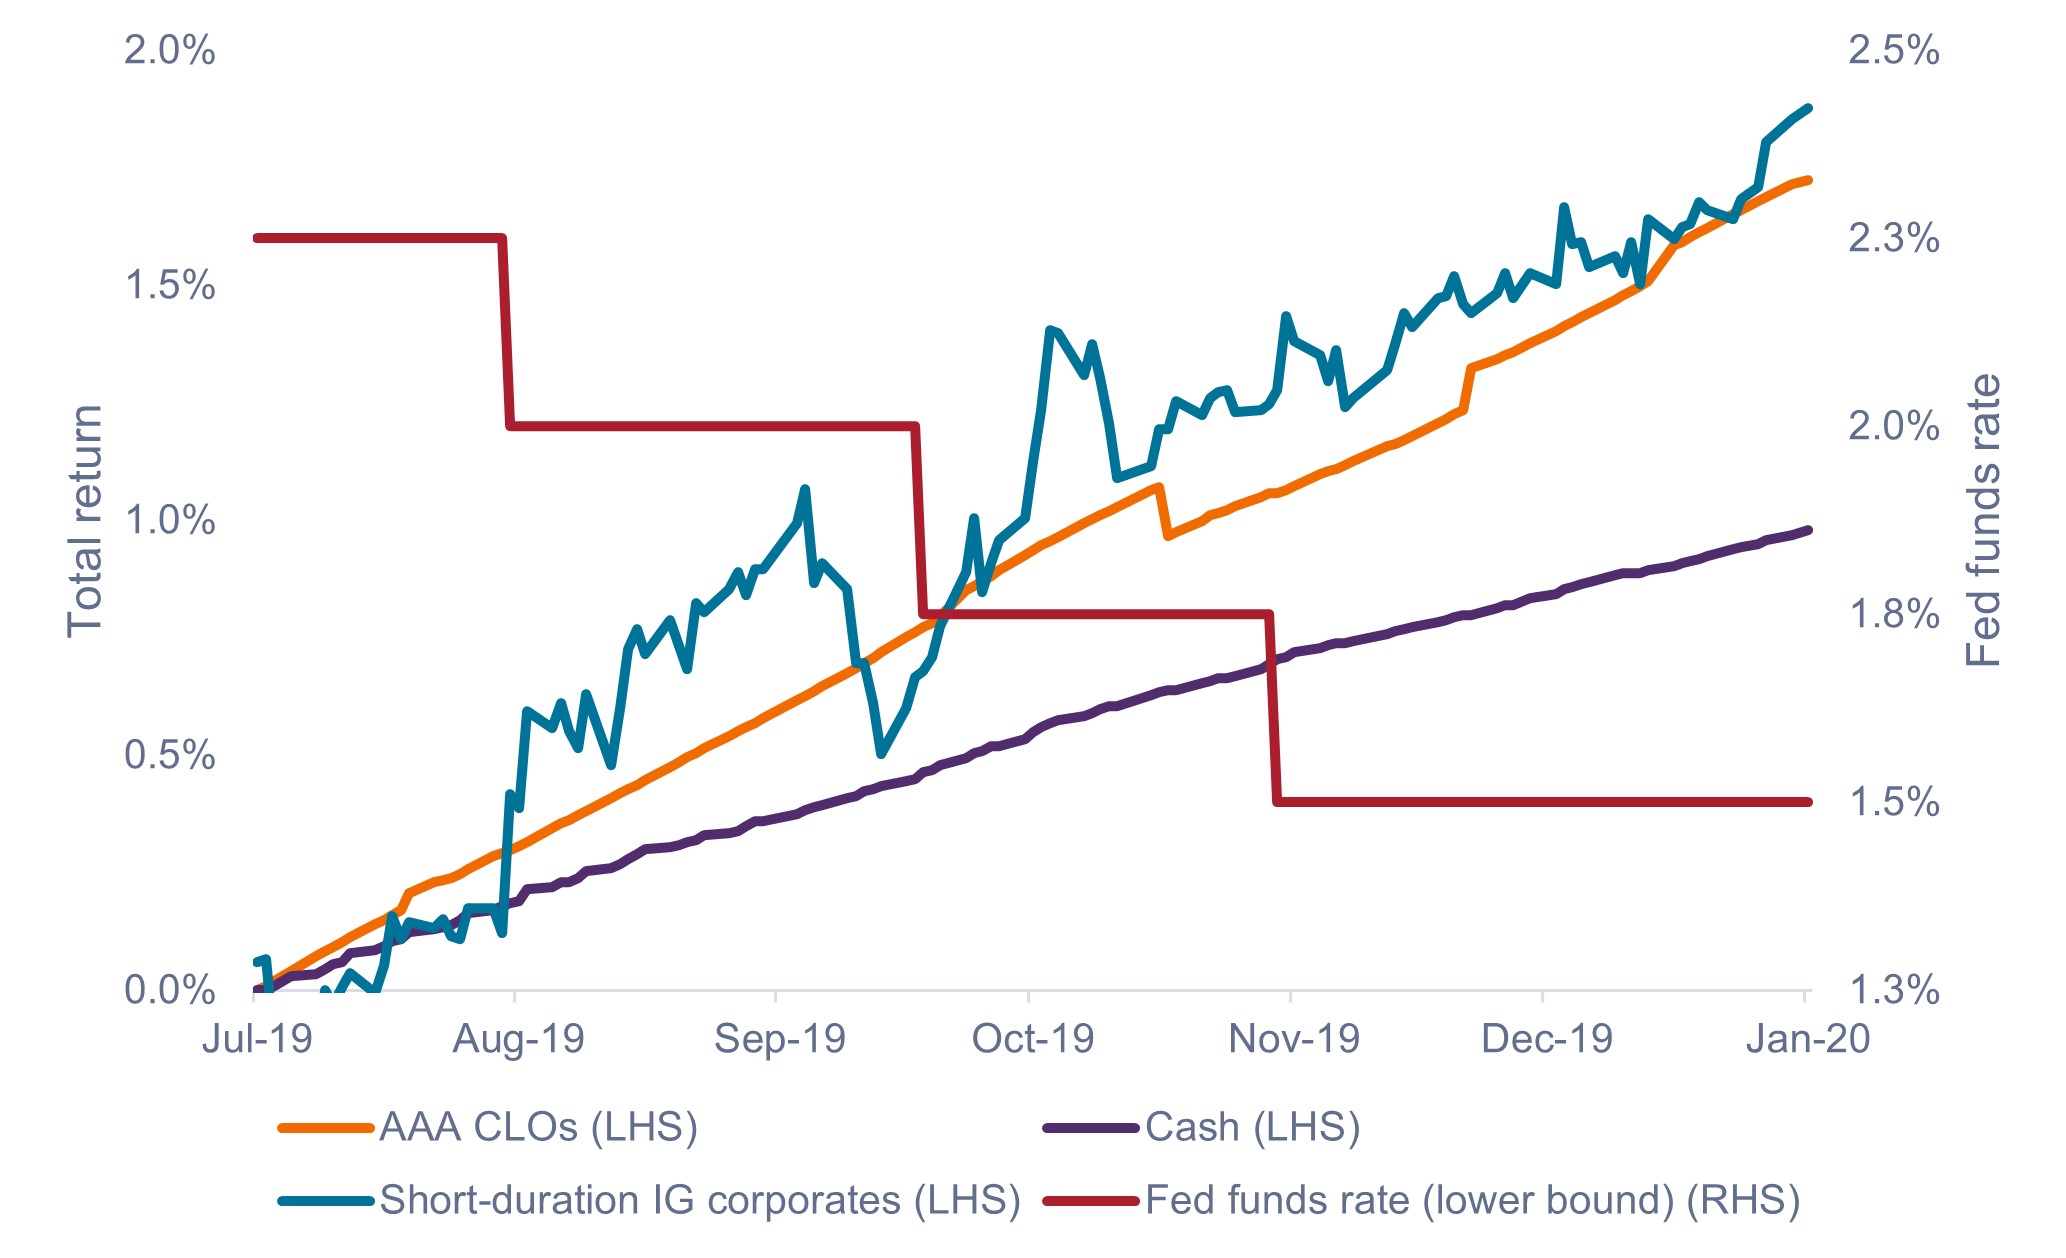 Source: Bloomberg, as of 22 August 2024. Indices used to represent asset classes as per Exhibit 2. Past performance does not predict future returns.
4. Lower-correlation volatility and improved risk-adjusted returns
Some investors – not wanting to put their short-term cash reserves at risk – may feel uneasy with any volatility within their short-duration bucket. (As represented by average rolling 1-year standard deviation in Exhibit 6, AAA CLOs and short-duration IG corporates do exhibit some volatility in contrast to cash, which is essentially a zero-volatility asset.)
However, according to our analysis, we believe many investors are too cautious in this regard and could handle more volatility in their short-duration bucket in exchange for higher potential returns. Historically, despite occasional drawdowns, AAA CLOs have still ended up comfortably ahead of cash over the long term.
Further, while drawdowns do occur in AAA CLOs, they are relatively small compared to other risk assets, have not been common historically, and the asset class has typically recovered within one or two quarters. In our view, aside from maintaining a modest cash allocation for immediate needs (0-3 months), we believe investors would be better served over the long term by taking on a small amount of volatility to improve their portfolio’s income-earning potential.
Exhibit 6: Key short duration metrics (Jan 2012 – Aug 2024)
| AAA CLOs | Short-duration IG corporates | Cash / Money market funds | |
| Largest quarterly gain* | 4.32% | 4.07% | 1.38% |
| Largest quarterly drawdown** | -4.38% | -2.47% | 0.00% |
| Total negative quarters | 5 | 11 | 0 |
| Annualized total return | 3.11% | 2.12% | 1.21% |
| Average rolling 1-year standard deviation | 1.3% | 1.4% | 0.1% |
Source: Bloomberg, J.P. Morgan, as of 22 August 2024. Data based on sequential (not rolling) calendar quarters. Indices used to represent asset classes as per Exhibit 2. *Largest quarterly gains: AAA CLOs and short-duration IG corporates: Q2:2020, Cash: Q4:2023. **Largest quarterly drawdowns: AAA CLOs: Q1:2020, Short-duration IG corporates: Q1:2022. Past performance does not predict future returns.
As shown in Exhibit 7, adding CLOs to the Bloomberg U.S. Aggregate Bond Index (U.S. Agg) may have improved long-term risk-adjusted returns, by increasing total return while also reducing standard deviation.
Exhibit 7: Historical hypothetical allocation scenarios (Jul 2014 – Jul 2024)
Impact of adding 10%, 20%, and 30% allocation of AAA CLOs to the U.S. Agg.
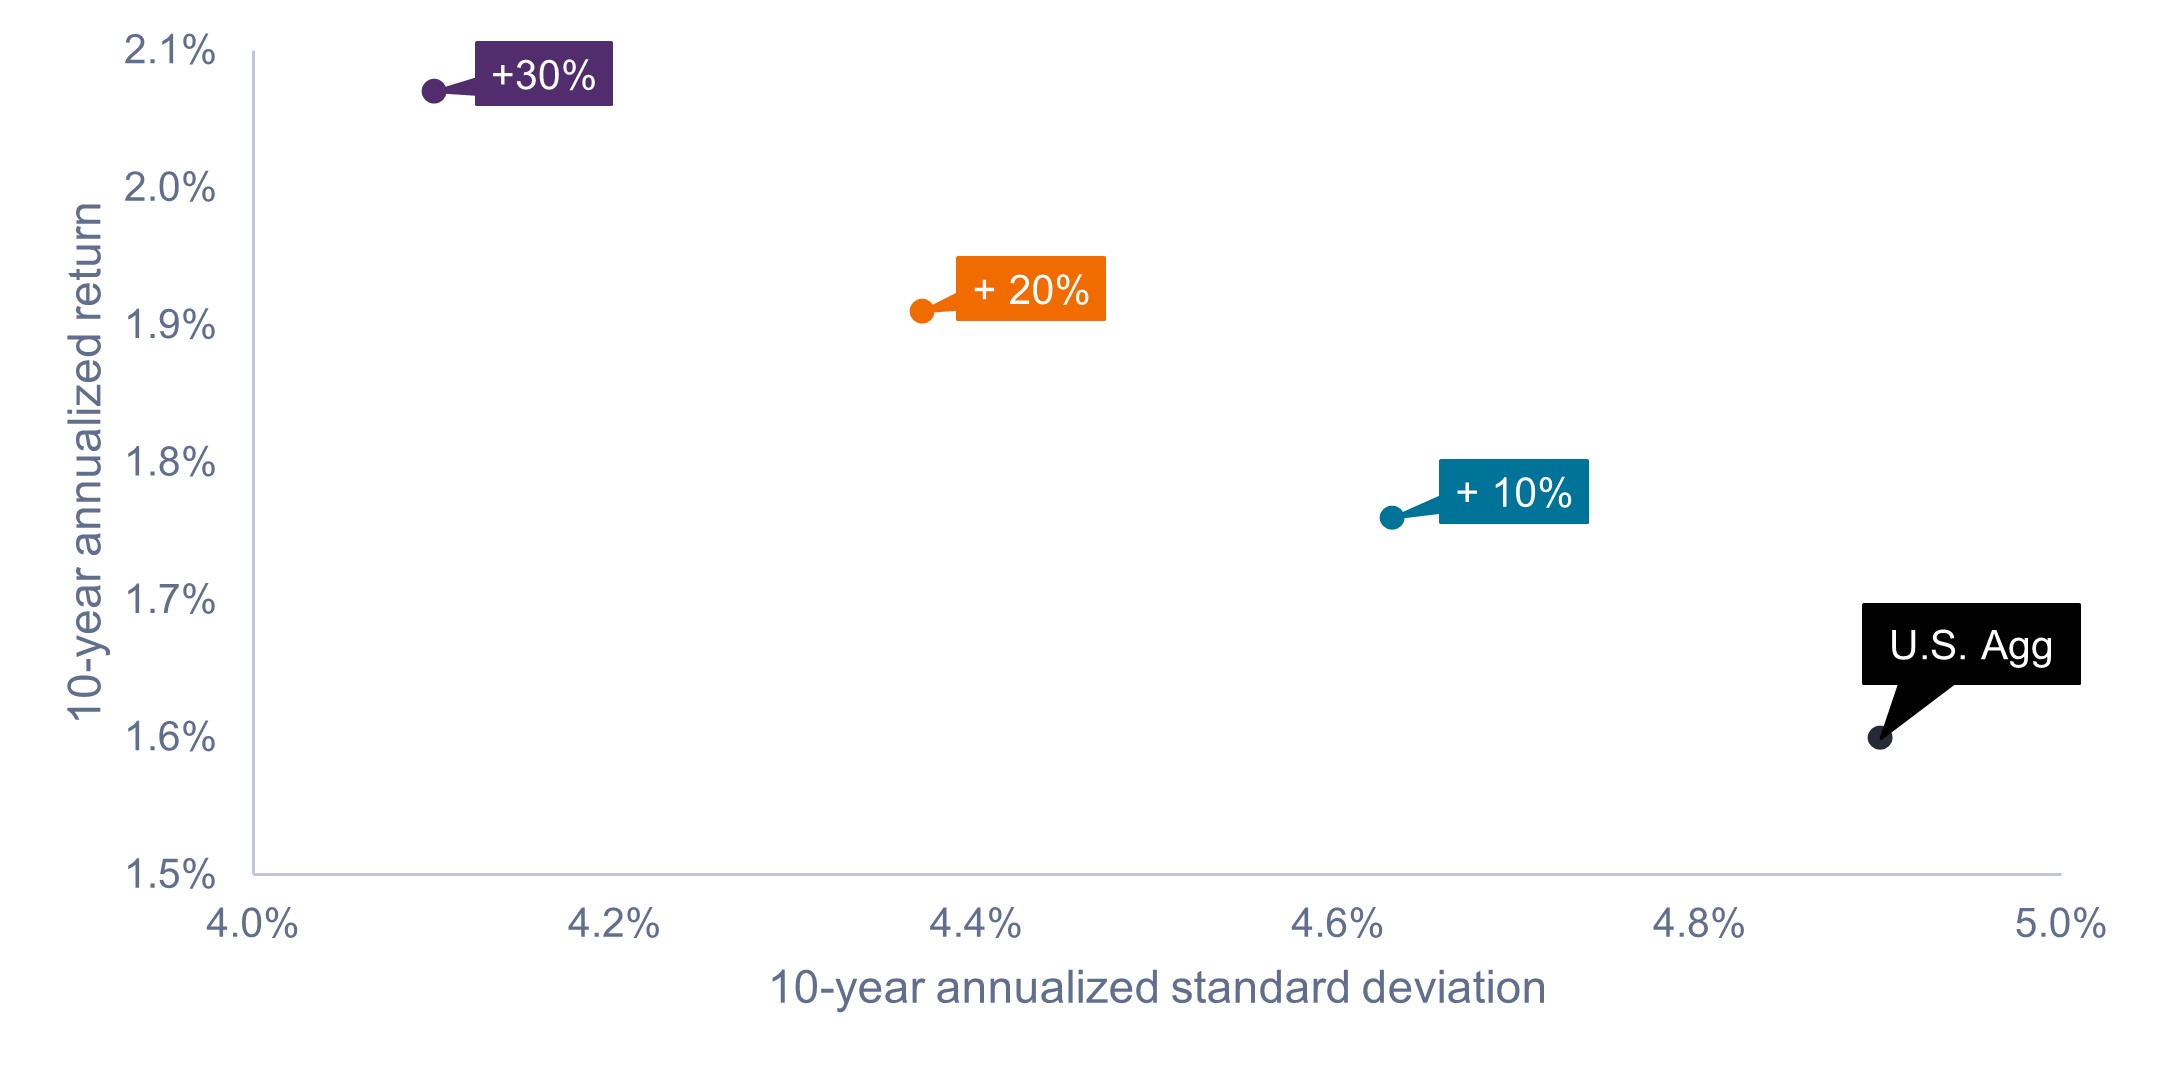 Source: Bloomberg, Janus Henderson Investors, as of 31 July 2024. Our analysis adds AAA CLO exposure on a pro rata basis to the Bloomberg U.S. Aggregate Bond Index to determine the historical effect of having 10%, 20%, and 30% AAA CLO exposure. Scenarios are hypothetical and performance is based on historical index returns. Investors should not assume they will have a similar investment experience. Hypothetical examples are for illustrative purposes only and do not represent the returns of any particular investment.
Conclusion
We believe investors should maintain diversification within their fixed income portfolios throughout the interest rate cycle. Therefore, in our view, an allocation to short duration remains highly relevant in the current environment, particularly considering how attractive short-term yields are.
Further, optimizing total return for one’s entire portfolio is vital to improving long-term risk-adjusted returns. As such, we believe a strategic allocation to AAA CLOs, with their attractive floating-rate yields, high credit quality, and low correlation to other fixed income sectors, remains a key component of a strategic fixed income allocation.
IMPORTANT INFORMATION
Derivatives can be more volatile and sensitive to economic or market changes than other investments, which could result in losses exceeding the original investment and magnified by leverage.
Fixed income securities are subject to interest rate, inflation, credit and default risk. The bond market is volatile. As interest rates rise, bond prices usually fall, and vice versa. The return of principal is not guaranteed, and prices may decline if an issuer fails to make timely payments or its credit strength weakens.
Collateralized Loan Obligations (CLOs) are debt securities issued in different tranches, with varying degrees of risk, and backed by an underlying portfolio consisting primarily of below investment grade corporate loans. The return of principal is not guaranteed, and prices may decline if payments are not made timely or credit strength weakens. CLOs are subject to liquidity risk, interest rate risk, credit risk, call risk and the risk of default of the underlying assets.
Diversification neither assures a profit nor eliminates the risk of experiencing investment losses.
10-Year Treasury Yield is the interest rate on U.S. Treasury bonds that will mature 10 years from the date of purchase.
Bloomberg US Treasury Index measures US dollar-denominated, fixed-rate, nominal debt issued by the US Treasury. Treasury bills are excluded.
Bloomberg U.S. Corporate 1-3 year Bond Index measures the investment grade, US dollar-denominated, fixed-rate, taxable corporate bond market with maturity between 1-3 years.
Bloomberg U.S. Aggregate Bond Index is a broad-based measure of the investment grade, US dollar-denominated, fixed-rate taxable bond market.
Correlation measures the degree to which two variables move in relation to each other. A value of 1.0 implies movement in parallel, -1.0 implies movement in opposite directions, and 0.0 implies no relationship.
Credit Spread is the difference in yield between securities with similar maturity but different credit quality. Widening spreads generally indicate deteriorating creditworthiness of corporate borrowers, and narrowing indicate improving.
Duration measures a bond price’s sensitivity to changes in interest rates. The longer a bond’s duration, the higher its sensitivity to changes in interest rates and vice versa.
J.P. Morgan CLO AAA Index is designed to track the AAA-rated components of the USD-denominated, broadly syndicated CLO market.
Mortgage-backed securities (MBS) may be more sensitive to interest rate changes. They are subject to extension risk, where borrowers extend the duration of their mortgages as interest rates rise, and prepayment risk, where borrowers pay off their mortgages earlier as interest rates fall. These risks may reduce returns.
A yield curve plots the yields (interest rate) of bonds with equal credit quality but differing maturity dates. Typically bonds with longer maturities have higher yields.
An inverted yield curve occurs when short-term yields are higher than long-term yields.
Volatility measures risk using the dispersion of returns for a given investment.
These are the views of the author at the time of publication and may differ from the views of other individuals/teams at Janus Henderson Investors. References made to individual securities do not constitute a recommendation to buy, sell or hold any security, investment strategy or market sector, and should not be assumed to be profitable. Janus Henderson Investors, its affiliated advisor, or its employees, may have a position in the securities mentioned.
Past performance does not predict future returns. The value of an investment and the income from it can fall as well as rise and you may not get back the amount originally invested.
The information in this article does not qualify as an investment recommendation.
There is no guarantee that past trends will continue, or forecasts will be realised.
Marketing Communication.
9 minute read
Key takeaways:
- With the economy and inflation cooling and the prospect of interest rate cuts on the horizon, some investors may be questioning whether to maintain an allocation to short-duration fixed income within multi-sector allocations.
- We believe investors should remain diversified within their fixed income portfolios throughout the interest rate cycle, with short duration being a key component of a well-rounded portfolio.
- Optimizing total return for one’s entire portfolio is vital to improving long-term risk-adjusted returns. As such, we believe a strategic allocation to AAA CLOs remains a key element of a strategic fixed income allocation.


