
Key takeaways:
- The myth of ‘concentrated’ and ‘opaque’ risk in securitised investments overlooks today’s clear diversity and the depth of assets in the securitised markets, such as within collateralised loan obligations (CLOs).
- CLOs are the largest asset class within the European securitised market and through their interplay with the loans market – the building blocks of CLOs – they provide a vital role in financing systemically important parts of the economy.
- Active engagement in the diverse CLO market allows for tailored portfolio construction, aligning with specific risk and return objectives through strategic selection of deals and CLO manager expertise.
A myth surrounding the securitised sector is that risk is ‘concentrated’ and ‘opaque’. Often, this is because when investors hear the word “securitised”, they have a cloudy memory of the Global Financial Crisis and link to subprime mortgages. Fast forward to today and the world is a very different place. In our ‘Fact versus Fiction’ series, we have sought to bust many of the myths around securitised debt and here we look at the diversity within the asset class, focusing on its biggest sub-sector, collateralised loan obligations or CLOs.
Too ‘concentrated’?
‘Securitised debt’ is a term for financial securities that are secured by contractual cash flows from assets such as mortgages, credit card receivables and auto loans. The European securitisation market is valued at nearly EUR€560 billion of outstanding distributed issuance[1]. It encompasses a diverse array of sectors (with different underlying asset types) spread across numerous jurisdictions (Figure 1 and 2). It is primarily financed through investment grade bonds, with more than 95% of these bonds achieving ratings of AAA, AA, A, and BBB (Figure 3).
Figure 1-3: European securitised market is a large and diverse investment opportunity
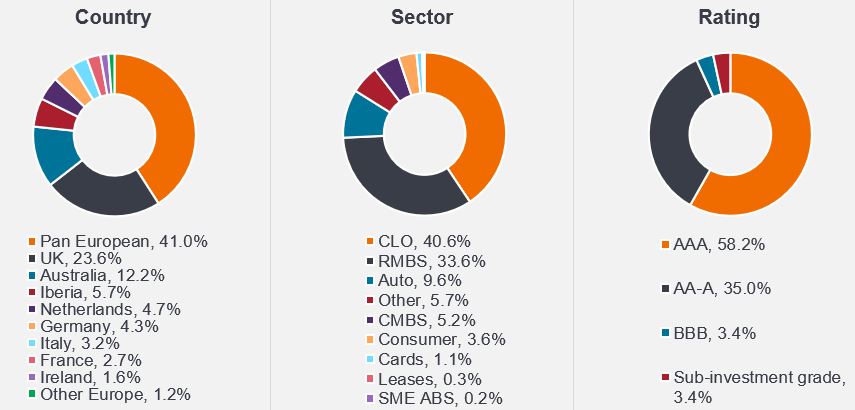
Source: Janus Henderson, JP Morgan, AFME, as at March 2024. Note: It is important to highlight that Australian securitisation refers specifically to transactions originating from Australia that comply with European securitisation regulations. These transactions involve a variety of issuers and are notably supported by a substantial European investor base.
Re-examining the role of the established CLO Market…
The CLO market constitutes the largest segment of the European securitisation market, accounting for over 40% of its volume. With the latest figures showing an outstanding market size exceeding EUR€250 billion[2], the CLO market is on a steady expansion trajectory. To put it into some sort of perspective, the European CLO market over the years has grown to around 65% of the size of the European high yield (HY) market (Figure 4).
Figure 4: CLO overall market as proportion of high yield market
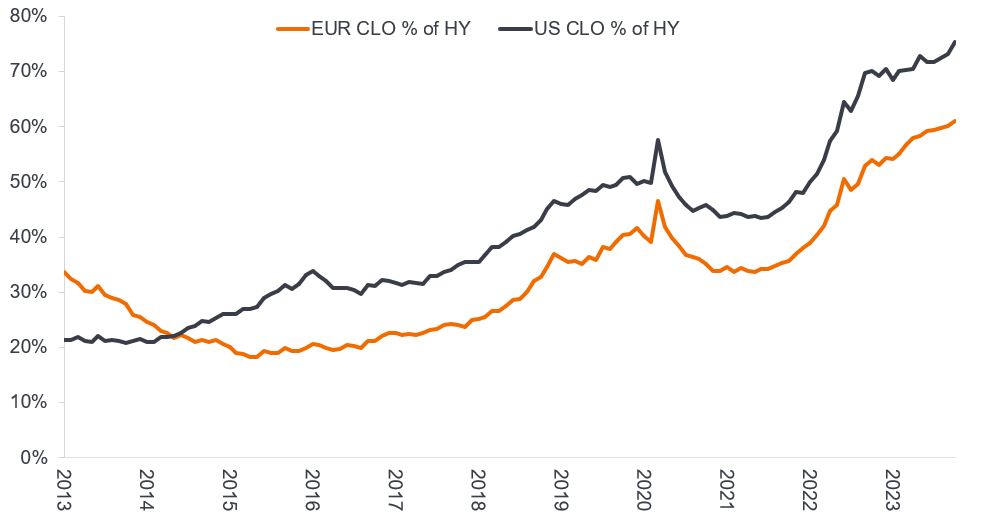
Source: Janus Henderson Investors, BofA Securities CLO Factbook, as at 10 November 2023. For illustrative purposes only.
…as it helps to finance companies
CLOs serve as a crucial financing mechanism for European corporations, enabling them to fund their economic activities through the issuance of corporate loans and bonds. These corporations are generally large-scale entities – typically with enterprise valuations on average in excess of €1 billion – that generate significant revenues, provide employment opportunities, and play a pivotal role in driving economic growth across a variety of sectors and European jurisdictions.
Figure 5 highlights some of the major corporate borrowers included in European CLO portfolios, also represented in the European High Yield index. Companies often use a mix of financing methods, as the table illustrates, showing some companies in both the loan and High Yield bond markets.
Figure 5: Example companies with loans in European CLOs
| Borrower name | Sector | European CLO holdings (%) | European high yield index (%) |
| Action | Retail | 1.0 | 0.0 |
| Ziggo | Media | 0.9 | 0.9 |
| Virgin Media | Media | 0.9 | 1.7 |
| MasOrange | Telecom | 0.9 | 0.0 |
| Verisure | Security services | 0.9 | 1.3 |
| Ineos Quattro | Chemicals | 0.8 | 0.5 |
Source: Janus Henderson Investors, Bloomberg, as at 20 December 2024.
Note: References made to individual securities do not constitute a recommendation to buy, sell or hold any security, investment strategy or market sector, and should not be assumed to be profitable. Janus Henderson Investors, its affiliated advisor, or its employees, may have a position in the securities mentioned. Use of third-party names, marks or logos is purely for illustrative purposes and does not imply any association between any third party and Janus Henderson Investors, nor any endorsement or recommendation by or of any third party. Unless stated otherwise, trademarks are the exclusive property of their respective owners.
High Yield index refers to ICE BofA European Currency Non-Financial High Yield 2% Constrained Index. European CLO holdings source: IntexCalc.
A broad spectrum of choices
Another perspective on the diversity within the CLO market is its sectoral representation. Figure 6 reveals that the European CLO universe encompasses a wide range of sectors.
While the investment grade market notably funds a significant portion of financial institutions, the CLO and loan markets play crucial role in backing vital sectors essential to the modern world, including healthcare, technology, services, media, and telecoms. These sectors hold systemic importance in various regions, notably France, the Netherlands, the UK, and Germany, among others.
Figure 6: Sector representation across European CLOs, loans and corporate credit
| Sector | European CLO Universe | Western Europe Lev Loan Index | European Investment Grade Index | European High Yield Index |
| Healthcare | 15.61% | 15.32% | 5.75% | 8.51% |
| Technology | 12.68% | 11.95% | 2.64% | 3.19% |
| Services | 15.28% | 15.60% | 3.29% | 8.21% |
| Media & Telecom | 10.57% | 12.08% | 5.56% | 17.37% |
| Finance Related | 6.07% | 5.95% | 37.00% | 0.06% |
| Retail Non-Food | 5.72% | 5.56% | 1.24% | 4.83% |
| Chemicals | 6.04% | 6.28% | 1.98% | 3.59% |
| Leisure | 4.53% | 4.45% | 0.26% | 3.76% |
| Food & Beverage | 5.03% | 5.41% | 3.99% | 1.11% |
| Manufacturing | 4.39% | 4.38% | 2.37% | 2.54% |
| Construction & Homebuilding | 3.98% | 3.74% | 3.03% | 4.26% |
| Paper & Packaging | 1.66% | 1.49% | 0.49% | 3.41% |
| Consumer Products | 1.59% | 1.79% | 1.17% | 0.76% |
| Real Estate | 1.01% | 0.88% | 5.41% | 6.55% |
| Automotive | 0.98% | 0.91% | 5.55% | 9.86% |
| Gaming | 0.83% | 0.82% | 0.02% | 1.79% |
| Restaurants | 0.45% | 0.34% | 0.43% | 0.62% |
| Retail Food | 0.36% | 0.30% | 0.45% | 2.79% |
| Transportation | 0.34% | 0.30% | 2.65% | 2.71% |
| Aerospace & Defence | 0.53% | 0.65% | 0.58% | |
| Utilities | 0.14% | 0.09% | 9.84% | 8.84% |
| Agricultural Products | 0.18% | 0.17% | 0.79% | 0.47% |
| Oil & Gas | 0.13% | 0.17% | 4.76% | 3.45% |
| Metals & Mining | 0.00% | 0.41% | 0.66% | |
| Other | 1.89% | 1.36% | 0.34% | 0.66% |
| Total | 100.00% | 100.00% | 100.00% | 100.00% |
Source: Janus Henderson, BAML/ICE, UBS, Bloomberg. As at 31 January 2025. European Investment Grade Index is ICE BofA Euro Corporate Index. European High Yield Index is ICE BofA European Currency Non-Financial High Yield 2% Constrained Index. European CLO universe: outstanding European CLO universe according to JHI.
Figure 7: Geographical representation across European CLOs, loans and corporate credit
| Country of Risk | European CLO Universe | Western Europe Lev Loan Index | European Investment Grade Index | European High Yield Index |
| France | 17.25% | 16.52% | 20.50% | 18.95% |
| United Kingdom | 17.74% | 18.12% | 6.82% | 14.41% |
| Netherlands | 13.49% | 13.98% | 5.73% | 4.09% |
| Luxembourg | 12.83% | 12.98% | 1.07% | 5.20% |
| Germany | 9.75% | 9.60% | 14.41% | 11.34% |
| United States | 12.82% | 14.50% | 18.67% | 10.47% |
| Italy | 1.39% | 0.00% | 5.95% | 9.51% |
| Sweden | 2.96% | 2.58% | 2.77% | 4.37% |
| Spain | 3.60% | 3.62% | 5.83% | 5.69% |
| Ireland | 1.67% | 1.61% | 0.91% | 0.72% |
| Finland | 0.83% | 0.72% | 1.38% | 0.92% |
| Belgium | 1.08% | 1.26% | 2.33% | 1.06% |
| Other Countries | 4.65% | 4.52% | 13.63% | 13.27% |
Source: Janus Henderson, BAML/ICE, UBS, Bloomberg. As at 31 January 2025. European Investment Grade Index is ICE BofA Euro Corporate Index. European High Yield Index is ICE BofA European Currency Non-Financial High Yield 2% Constrained Index. European CLO universe: outstanding European CLO universe according to JHI.
Diverse and transparent investment opportunity set
The diversity of sectors across jurisdictions provides a rich landscape for active investment and risk management in the corporate loans market. With approximately 67 CLO managers overseeing more than 640 unique CLO deals, each transaction offers something distinct. CLO managers bring their investment strategies and credit expertise to the table, actively navigating CLO transactions through economic cycles.
Similarly, CLO bond investors can pursue their active investment approaches, choosing CLO deals from managers that best resonate with their own investment principles. This enables the construction of CLO portfolios designed to meet specific risk and return goals.
This underscores the value of an active investment stance in CLOs. By leveraging the variety of deals and CLO manager expertise, investors can better tailor a portfolio that matches their risk and return preferences.
Footnotes
[1] Source: Janus Henderson Investors, JPM & AFME, as at 31 March 2024.
[2] Source: Janus Henderson Investors, Bloomberg, Intex Calc and JP Morgan Indices, 29 November 2024.
These are the views of the author at the time of publication and may differ from the views of other individuals/teams at Janus Henderson Investors. References made to individual securities do not constitute a recommendation to buy, sell or hold any security, investment strategy or market sector, and should not be assumed to be profitable. Janus Henderson Investors, its affiliated advisor, or its employees, may have a position in the securities mentioned.
Past performance does not predict future returns. The value of an investment and the income from it can fall as well as rise and you may not get back the amount originally invested.
The information in this article does not qualify as an investment recommendation.
There is no guarantee that past trends will continue, or forecasts will be realised.
Marketing Communication.