Fact versus fiction: Are European securitisations ‘risky’ and ‘illiquid’?
European securitised investments are ‘risky’ and ‘illiquid’, a stigma perpetuated by the Global Financial Crisis (GFC). Head of Secured Credit Colin Fleury unravels these myths by examining actual historical evidence – both over the short and long term.

10 minute read
Key takeaways:
- European securitised assets are often misconceived as ‘risky’ and ‘illiquid’, yet structural protections and historical performance demonstrate their resilience, stability and liquidity.
- Investors might therefore overlook these assets, missing out on a defensive income opportunity that offers higher average quality, lower interest rate risk and attractive credit spreads relative to comparable corporate credit.
- By incorporating European securitised investments into portfolios, investors can achieve better diversification, manage risk effectively, and tap into a source of stable income, counteracting the unfounded myths.
What is the worst that can happen?
The structural protections embedded within European securitised investments can offer valuable buffers against losses. In the event of underlying loan portfolio defaults, the equity component of a securitised structure provides protection to the bonds, with losses only realised by the debt tranches in order of priority (AAA last) once the equity has been fully written off.
This form of credit enhancement, called ‘tranching’, also creates a waterfall structure, where cashflows are allocated to the higher-rated tranches first and work their way down to the lower-rated tranches. To compensate for the extra risk, investors in the junior-ranked tranches receive a better yield than those higher up the capital structure. Tranching also provides investors with the flexibility to tailor portfolios to specific risk-return objectives, as it determines the specific repayment and credit profiles for a particular bond in the structure.
Other forms of credit enhancement to improve the credit quality of securitised debt include the following:
- over-collateralisation, where the face value of the underlying assets in the collateral pool is higher than the bonds it backs, providing protection to all tranches.
- excess spread, often the first line of defence in absorbing potential losses, is where the interest earned on collateral pool exceeds the coupon payable on the securities and expenses.
- cash reserve funds, often funded by the originator designed to cover interest and expense shortfalls and losses in the collateral pool.
The amount and form of credit support differs by tranche rating and instrument type. Residential mortgage-backed securities (or RMBS) tend to use excess spread and subordination, whereas for commercial mortgage-backed securities (or CMBS), over-collateralisation and reserves are common. A securitisation transaction also naturally de-levers over time, as investments can be fully or partially amortising. This means that immediately or after a specific period, repayments from the underlying collateral portfolio are used to repay principal. The impact of this is less borrower refinancing risk for investors, compared to say a corporate bond, which typically have a large principal payment at maturity.
One way to bring to life the impact of such protections is to consider the credit support available against the worst losses seen in the asset class. For a AAA CLO, for example, the typical credit support is 40% – until cumulative collateral losses exceed 40%, the AAA notes do not take a capital loss. This is two and a half times greater than the worst collateral losses seen in the asset class (Figure 1). In fact, no European AAA, AA and A-rated CLO tranche has ever defaulted[1].
Figure 1: Structured to absorb extreme loss scenarios
Illustrative credit support levels versus historical losses on underlying collateral across securitised sectors
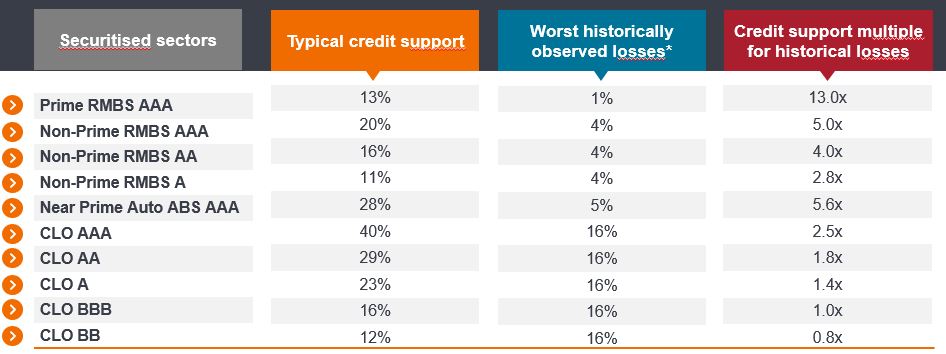
Source: Janus Henderson Investors, Moody’s, selected individual transactions from investor presentations, as at 31 December 2023.
Note: *Worst historically observed losses: CLOs – based on worst 6-year cumulative defaults for the period between 2007 – 2020, based on Moody’s speculative grade default data and recovery rate of 60%. Prime and non-conforming RMBS – based on cumulative losses for the period 2007 – 2019. Prime auto ABS – based on Moody’s 5-year cumulative loss data on deals up to 2013, Near prime auto – based on selected individual transactions worst vintage cumulative defaults and 40% recovery rate. Janus Henderson estimates for illustrative purposes only. Typical Credit Support includes some assumed portion of excess interest earned by the underlying collateral. Each transaction will be different and the above are Janus Henderson’s ABS team views and should not be construed as advice. Past performance does not predict future returns.
Resilient liquidity during market stress
Another way to assess the ‘riskiness’ of investments is to consider how easy it is to sell out of them when you need to alongside the price that investors have to pay. As an active investor in the securitisation markets for over 15 years, experience tells us that liquidity is far better than many might perceive. During the market volatility induced by the Covid pandemic and the UK Liability-driven investment (LDI) crisis in 2022, liquidity held up relatively well in the European securitised sector. With the issues driven by rising rates, pension schemes often looked first to sell down floating rate assets, such as securitised, to avoid crystallising larger capital losses in fixed rate bonds. While the LDI-related turmoil resulted in a spike in trading volumes in European securitised, this was absorbed by a range of investors. The subsequent dislocation in European securitised prices saw the likes of bank treasuries and even private equity firms step in to pick up what remained fundamentally high-quality assets, but at attractive discounts. Around €13 billion of European securitisations were sold over four weeks from the end of September and volumes absorbed well[2].
This highlights the ability of the securitised market to absorb significant supply (over a very short space of time) and provide liquidity to investors when they need it most. This is reflected in the publicly reported trading volume in the market, typically measured using “Bids Wanted in Competition” (BWIC or auction processes run by end investors to sell bonds), with volumes providing a good indication of secondary market trading activity (and liquidity), as shown in Figure 2. The costs of liquidity – the difference between the bid and offer price of a bond – unsurprisingly tend to spike during periods of extreme trading levels, but these were generally not excessive when we look at the second half of 2022 and quickly normalised. This can be seen in Figure 3 below which focuses on European AAA CLOs.
Figure 2: European securitised BWIC volumes in euro (million)
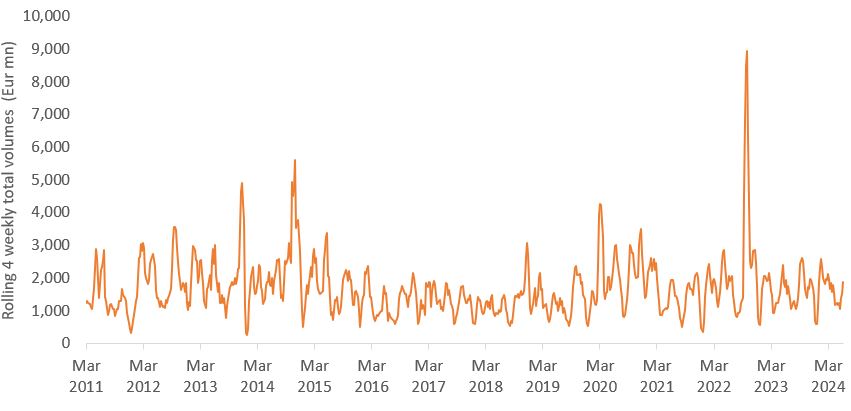
Source: Janus Henderson Investors, Deutsche Bank as at 30 August 2024.
Figure 3: Active market during times of stress with rapid normalisation of cost of liquidity
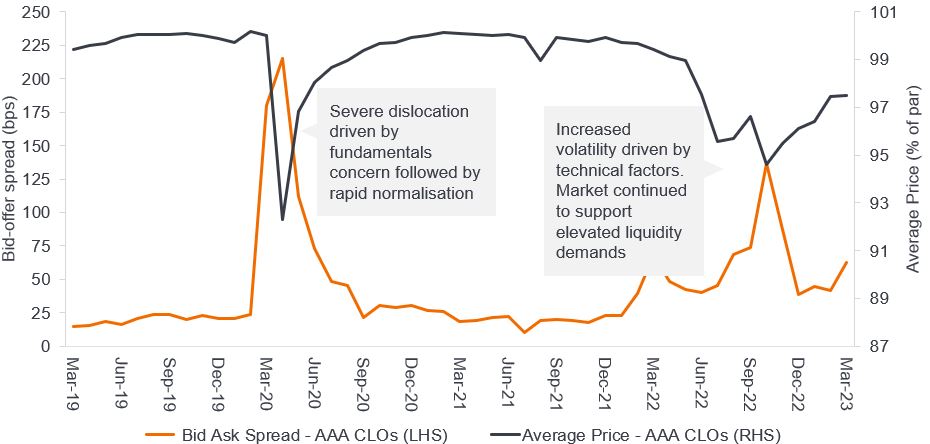
Source: Janus Henderson Investors, JP Morgan, as at March 2023. There is no guarantee past trends will continue.
Three truths around European securitised
So rather than being ‘risky’ and’ ‘illiquid’, even in times of market stress, securitised assets have proved to be resilient in terms of liquidity and returns. This is even more apparent when considering long-term returns against volatility delivered by the European securitised sector. Here we consider the three truths around the European securitised sector:
- Attractive risk and return profiles – Securitised generally has a higher average credit quality than corporate bond indices and a shorter spread duration (see Figure 4). Amortising structures and the short-dated nature of large parts of European securitised naturally lowers spread duration. Similarly, the floating rate nature of the asset class limits the impact of moves in interest rates (which amplifies the volatility of mark-to-market returns in longer duration fixed income). Resultingly, risk-adjusted returns stack up well relative to other areas of fixed income (see Figure 5).
Figure 4: Higher average quality, lower interest rate risk and attractive relative credit spreads for securitised versus investment grade
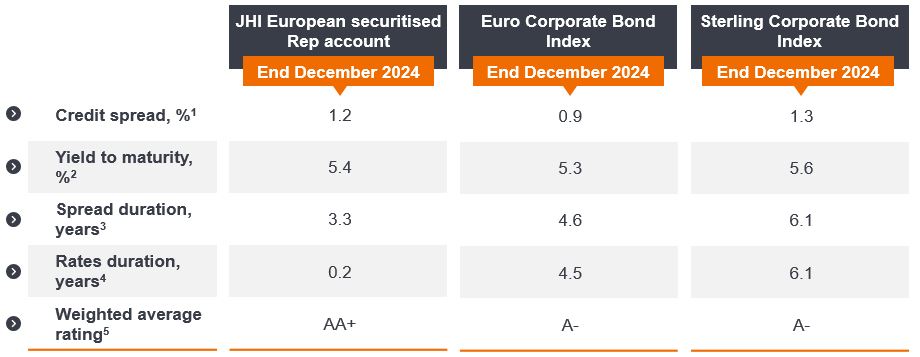
Source: Janus Henderson Investors, Bloomberg. Euro Corporate Bond index: ICE BofA Euro Corporate Index. Sterling Corporate Bond Index: ICE BofA Sterling Corporate Bond index as at 31 December 2024.
Note: Data shown for the JHI European securitised Rep account is referencing Janus Henderson Asset Backed Securities Fund.
1 Credit spreads are versus SONIA for the ABS Fund. Bond index credit spreads are Swap OAS.
2 Yield shown for the Janus Henderson ABS Fund and corporate bond indices are calculated by summing credit spread and swap rate corresponding to weighted average life.
3 Spread duration is based on modelled base expected average life for the invested portfolio of the ABS Fund.
4 Reset dates used for floating rate investments in calculations for the invested portfolio.
5 Excludes cash balance.
Yields may vary and are not guaranteed.
Figure 5: European securitised delivers a high sharpe ratio and low volatility compared to major fixed income asset classes
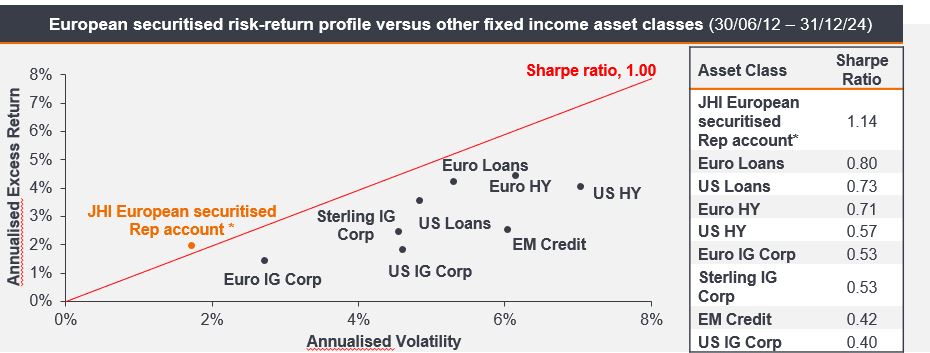
Source: Janus Henderson Investors, as at 31 December 2024. European securitised Representative account: Janus Henderson Asset-Backed Securities Fund Gross of fees in GBP. Index: SONIA (Sterling Overnight Index Average). Index usage: Target. Bloomberg Pan European FRN ABS Bond Index, ICE BofA corporate bond and US ABS indices, Credit Suisse leveraged loan indices,
*The data shown is of the Asset Backed Securities portfolio sleeve of the Janus Henderson Horizon Total Return Bond Fund up to September 2020 and Janus Henderson Asset-Backed Securities Fund thereafter, to demonstrate the ABS team’s performance track record and is for illustrative purposes only. The fund managers have been running this portfolio sleeve since March 2012. Note that any differences among portfolio securities currencies, share class currencies and costs to be paid or represented in currencies other than your home currency will expose you to currency risk. Costs and returns may increase or decrease as a result of currency and exchange rate fluctuations.
Notes: Returns are hedged to GBP, gross of fees. Volatility is based on standard deviation. Since Inception date: 31 March 2012. Sharpe Ratios are calculated by dividing Excess Returns by Volatility. Please see end of presentation for index descriptions. Index returns are hedged to GBP. For a full list of index descriptions please see the last slide of the presentation.
Past performance does not predict future returns.
- Improved diversification – The sector’s diversification potential (Figure 6) is reflected in the low correlation of the European securitised sector to other credit fixed income asset classes. One of the most comparable is high quality IG credit, relative to which European securitised assets tend to show lower volatility. When looking over the past decade, relative to IG credit, AAA CLOs delivered superior yields with around half the volatility (Figure 7).
Figure 6: European securitised has a low correlation to typical institutional asset classes
5-year monthly return correlation
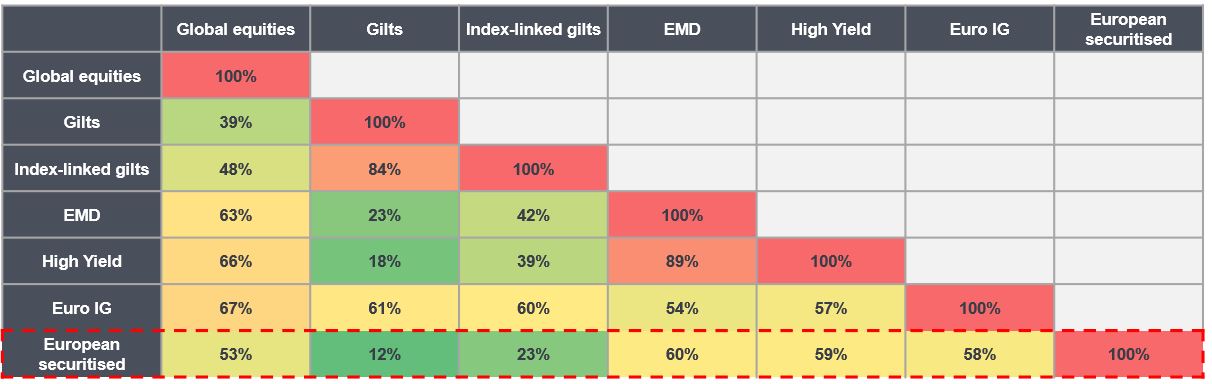
Source: Bloomberg, Janus Henderson Investors Analysis, as at 30 September 2024.
Note: European securitised represents the Janus Henderson Asset-Backed Securities Fund Z inc GBP Hedged, gross of fees from October 2020 given the fund’s inception date: 15 September 2020. Prior to this, performance track record for our ABS strategy reflects the ABS sleeve of the Janus Henderson Horizon Total Return Bond Fund.
Indices: ICE BofA Euro Corporate Bond Index; FTSE UK Gilts Over 15 Years Index; FTSE UK Gilts Index-Linked Over 5 Years Index; J.P. Morgan EMBI Global Diversified Index; ICE BofA Global High Yield Constrained Index; MSCI All Countries World Index
Past performance does not predict future returns.
Figure 7: Better or equivalent yield from AAA CLO delivered with lower volatility
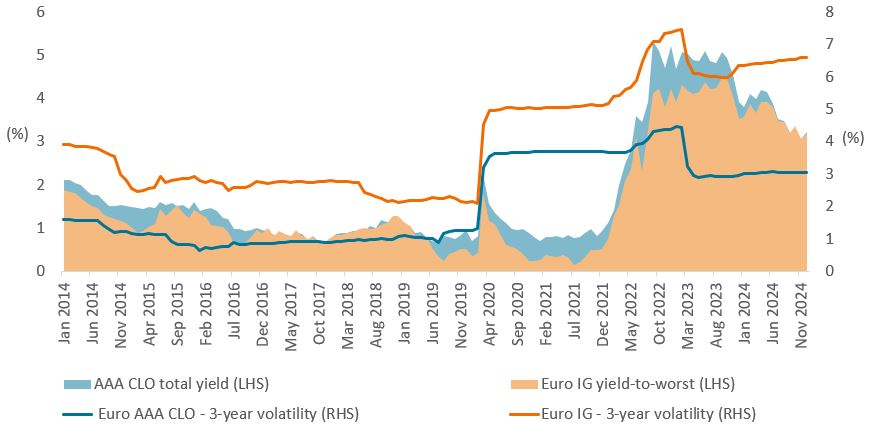
Source: Bloomberg, Citi, ICE indices, as a 31 December 2024. IG: ICE BofA Euro Corporate Index. For CLO, total yield is calculated as credit spread plus the swap rate corresponding to average life. This is the 4-year Euro SWAP rate. For IG, yield-to-worst is presented. For volatility, 3-year total return volatility for CLO is estimated using AAA CLO spread moves, assumed carry and cash returns. Cash returns are estimated using 1m Euribor. Yields may vary and are not guaranteed.
- Managing portfolio duration – With the vast majority of the European securitised market being floating rate, investors can access credit excess returns whilst separately managing their interest rates hedging strategy, or hold duration elsewhere in their fixed income allocation when they deem it attractive to do so.
In summary, the perception of European securitised investments as inherently ‘risky’ and ‘illiquid’ is a myth not supported by historical evidence. Structural safeguards in securitisations significantly mitigate risk and enhance credit quality, debunking concerns about their safety. Furthermore, the resilience of these assets during market upheavals demonstrates their liquidity and capacity to normalise and offer compelling risk-adjusted returns over the long term. This robust performance, coupled with benefits like higher credit quality, lower interest rate risk, and portfolio diversification, shows the unfounded nature of the myths surrounding securitised assets and highlights their value as a strategic component of diversified fixed income portfolios.
Footnotes
[1] Source: Moody’s Investors Services, Janus Henderson Investors. Please note defaults and losses are for overall market, CLO transactions due to restrictive eligibility criteria typically experience lower default rates, 2023.
[2] Source: Janus Henderson Investors estimates and BWIC volumes between 30 September 2022 and 21 October 2022.
These are the views of the author at the time of publication and may differ from the views of other individuals/teams at Janus Henderson Investors. References made to individual securities do not constitute a recommendation to buy, sell or hold any security, investment strategy or market sector, and should not be assumed to be profitable. Janus Henderson Investors, its affiliated advisor, or its employees, may have a position in the securities mentioned.
Past performance does not predict future returns. The value of an investment and the income from it can fall as well as rise and you may not get back the amount originally invested.
The information in this article does not qualify as an investment recommendation.
There is no guarantee that past trends will continue, or forecasts will be realised.
Marketing Communication.
10 minute read
Key takeaways:
- European securitised assets are often misconceived as ‘risky’ and ‘illiquid’, yet structural protections and historical performance demonstrate their resilience, stability and liquidity.
- Investors might therefore overlook these assets, missing out on a defensive income opportunity that offers higher average quality, lower interest rate risk and attractive credit spreads relative to comparable corporate credit.
- By incorporating European securitised investments into portfolios, investors can achieve better diversification, manage risk effectively, and tap into a source of stable income, counteracting the unfounded myths.


