Too big to ignore? Unlocking the potential of EM debt
Portfolio Managers Jacob Nielsen and Thomas Haugaard highlight the evolution of Emerging Markets Debt Hard Currency, dispel some common misperceptions about the asset class and discuss how active management and a focus on sovereign credit risk analysis can deliver benchmark-relative upside.

20 minute read
Key takeaways:
- Emerging Markets Debt Hard Currency (EMDHC) is a continually evolving, diversified asset class; one that is arguably too big to ignore (almost twice the size of the US high yield market) and representing more than 40% of global GDP as well as 80% of the global population. Over the medium term, EMDHC had one of the highest risk-adjusted returns among public fixed income asset classes.
- Policy improvements in emerging markets tend to be underappreciated by investors over the medium term. Further, country fundamentals for weaker countries are typically not as bad as some headlines might suggest.
- Within EMDHC, what matters is sovereign credit risk. There exists a systematic relationship between market movements and anticipated country credit ratings, and sovereign credit risk represents a slow-moving core component of the asset class that can be modelled to forecast country ratings. Investors should look past near-term market noise and understand that EM sovereign credit has an “anchor” that helps limit the size and length of drawdowns versus other EM asset classes.
In this article, we will look at the evolution of the Emerging Markets Debt Hard Currency (EMDHC) asset class, dispel some common misperceptions of this asset class and explain the importance of understanding sovereign credit risk expectations as a core component of market movements. Further, we will outline why asset owners should consider an allocation to this evolving universe, and the potential for bottom-up active investment management to add value in this space.
First, let us define what we mean by EMDHC. These are bonds issued by emerging market governments, including quasi-sovereigns, denominated in hard currency – typically US dollars or euros. The hard currency aspect means there is no direct exposure to fluctuations in local EM currencies.
Most investors in this asset class also have opportunities to invest in government majority-owned EM corporates and pure corporates. At Janus Henderson, our EMDHC focus is primarily on sovereign and sovereign-related risk. The performance benchmark many investors use for this asset class is the JP Morgan Emerging Markets Bond Index Global Diversified (EMBIGD).1
The evolution of the asset class
Since we first started investing in this asset class as a team in 2013, we have seen a significant increase in the number of countries in our universe – from 56 to 70 today. From the early evolution of the asset class in the early 1990s, the increase relative to today is even more dramatic: from 14 countries to the current 70.2
This makes EMDHC one of the broadest asset classes in terms of country exposure globally. Collectively, these countries constitute approximately 80% of the world’s population and are a major driver of global economic activity. These countries, collectively, drive more than two-thirds of global growth and account for more than 40% of GDP globally, measured in US dollar terms. Adjusted for differences in purchasing power, the share of global GDP is around 60%.
Simply put, this asset class is continuing to grow and evolve, and is now too big to ignore. Another important point to make is that this asset class needs to be viewed not as one “Emerging Market”, but rather as a very diverse grouping of countries that happen to share a common descriptor.
Perceptions around Emerging Markets (EM) have undoubtedly been distorted by a string of EM crises in the 1990s and early 2000s, but these misperceptions can largely be dispelled by looking at what has happened in EM more recently.
Why consider EM debt hard currency?
Below, we outline various reasons asset owners and their advisers should consider an allocation to this asset class.
Size. This asset class, in aggregate, is almost twice the size of the US high yield market.3 In terms of individual issuance size, most EM government bonds and quasi government bonds are relatively large. In the aforementioned JP Morgan EMBIGD benchmark, issuance size is US$500 million and above, and there are plenty of US$1 billion-plus issuances.
Fundamental diversification. As an asset class driven by macroeconomic fundamentals and global risk sentiment, EMDHC offers significant fundamental diversification in terms of global economic exposure. Around half of the countries in our universe are commodity importers and the other half are commodity exporters. Countries in our universe range from the high growth, very commodity dependent all the way to more innovative, service sector driven economies.
You really have a plethora of very different economic development levels, many different policy frameworks and many different structural characteristics for each and every economy. The asset class offers access to everything from the fastest growing frontier names in sub-Saharan Africa to some of the more diversified middle-income and higher middle-income countries in the world. That means that when you have shocks you will typically have winners and losers, not just losers, providing a degree of resilience at the aggregate level.
Absence of FX risk. This asset class affords access to a diverse opportunity set of fast-growing economies without introducing FX risk, which is something that typically dominates returns when you look at asset classes such as EM equities and EM local currency debt.
Benchmark diversification. Within the suite of diversified EMBI indices that we look at there are no country weights that are much higher than 5%. For example, as of 30 April 2024, China’s weight is below 4% – nowhere near as dominant as in EM equity and EM local currency debt benchmarks.4
In essence, these are indices that do not have a few countries dominating and skewing the opportunity set. Rather, every single country matters a little. And in terms of credit ratings, you have a similar picture: a spread of lower rated names – such as those in Sub-Saharan Africa – to a lot of higher rated names, like the UAE and other countries in the Middle East.
Substantial investment grade component. One of the misperceptions around our asset class – because it has the word “emerging” in it – relates to credit quality. Figure 1 shows the ratings split between investment grade (IG) and high yield (HY). As you can see, approximately 50% of the benchmark is IG. Of course, there was a significant improvement in that share during the high-growth globalisation years, with China entering the world economy from around 2001 onwards. Since the global financial crisis, the IG component has been pretty stable.
Figure 1: Improving fundamental credit quality over time
JP Morgan EMBI ratings split – IG versus HY

Source: JP Morgan, Janus Henderson. JP Morgan Emerging Markets Bond Index as of 29 February 2024.
Improving macroeconomic policy frameworks. Policy quality in EM is generally underestimated by investors and EM fundamentals are often not nearly as bad as some headlines might suggest. In short, there has been a marked improvement in policy frameworks, more than most people recognise. Most importantly, since the 1990s, we have seen a transition towards flexible exchange rates and a move towards more independent central banks with inflation targets – similar economic policy frameworks as seen in most developed economies. There has also been a buildup of FX reserves in many EM countries, providing a credibility buffer for existing floating exchange rate regimes.
Market participants seem to be starting to appreciate the more robust macroeconomic policies in most EMs that have enabled them, by and large, to better weather the macro shocks of the past decade (especially the COVID years). You will always have a few odd cases that will attract a lot of attention. Turkey used to be one of them. Argentina is always one of them. However, most EM countries have actually weathered inflationary shocks quite well, and that is a testament to policy changes that have allowed them to let their exchange rates float and even allowed them to start cutting interest rates ahead of the US Federal Reserve (Fed).
Access to alternative funding sources. Unlike corporates, sovereigns always continue to function even if they end up in some sort of distress and are unable to finance themselves via external public debt issuance. (A case in point being various sub-Saharan African countries that survived despite external debt markets being effectively closed to them for more than a year.)
EM sovereigns have access to alternative sources of financing via the IMF and other multilateral lenders as well as their ability to tax the domestic economy. Unlike corporates that might need to take steps to improve their credit metrics before they can regain market access, EM countries that find themselves in distress can get front-loaded liquidity and financing, typically in return for promising to improve some of their policies. Currently, roughly half of the high yield countries in our universe are in IMF programmes that include conditionalities around fiscal consolidation, certain structural reforms, and so on.
EMs have already gone through a default cycle. We are now in a particularly interesting point in time in EM, not least in view of the painful adjustments we have seen in recent years, with a number of high yield countries having turned to the IMF for assistance. In EMs, we have already had a default cycle of sorts and we do not foresee new defaults around the corner. In fact, we are now seeing EM countries recovering and several sovereign restructurings being wrapped up or in very advanced stages.
Clearly, the current high cost of capital means we will see winners and losers in our space – as always. But we are also seeing some signs of normalisation in that some of the countries that have been under stress in recent years due to high inflation and tight financial conditions, and countries that have been pushed towards the IMF, are slowly coming back to the market.
This recovery/normalisation stands in contrast to the US cycle, where debate is ongoing as to whether the economy is late-cycle or mid-cycle. Whatever the case, we believe EMs are ahead in the cycle compared to the US, and that presents some opportunities.
A thing to note is that historically, emerging markets sovereigns have exhibited a lower capital weighted default rate than corporates on a rating-adjusted basis. In addition, the average recovery rate has been higher, reflecting that, unlike corporates, sovereigns cannot just liquidate and run away from their debts. On the contrary, governments need to preserve a good relationship with bondholders because it can have devastating economic consequences for a country to be shut out from financial markets. Argentina, which did not have access to financial markets from 2002 to 2015, is a glaring example of this.
Superior economic growth. A typically good indicator of how EMs will do versus the US is to look at their respective economic growth rates. When growth in EMs is much higher than in the US, it usually indicates that fundamentals are improving. And provided US growth is not too high, it also means that financial conditions are not simultaneously tightening a lot. That is typically the best environment for EMs – a US economy that is not too hot or too cold.
If you look at the period since the global financial crisis, we have basically had almost a continuous decline in the EM/US growth differential (with an interruption in 2016—17) and then again in recent years, with the US economy remaining more resilient than most people expected. Upside surprises to US growth recently have weighed a little on the EM/US growth differential forecast for 2024. Nonetheless, the EM/US growth differential is expected to pick up in the years ahead and stay elevated. Figure 2 shows IMF forecasts of the EM/US growth differential.
Figure 2: EM/US growth differential forecast to widen again
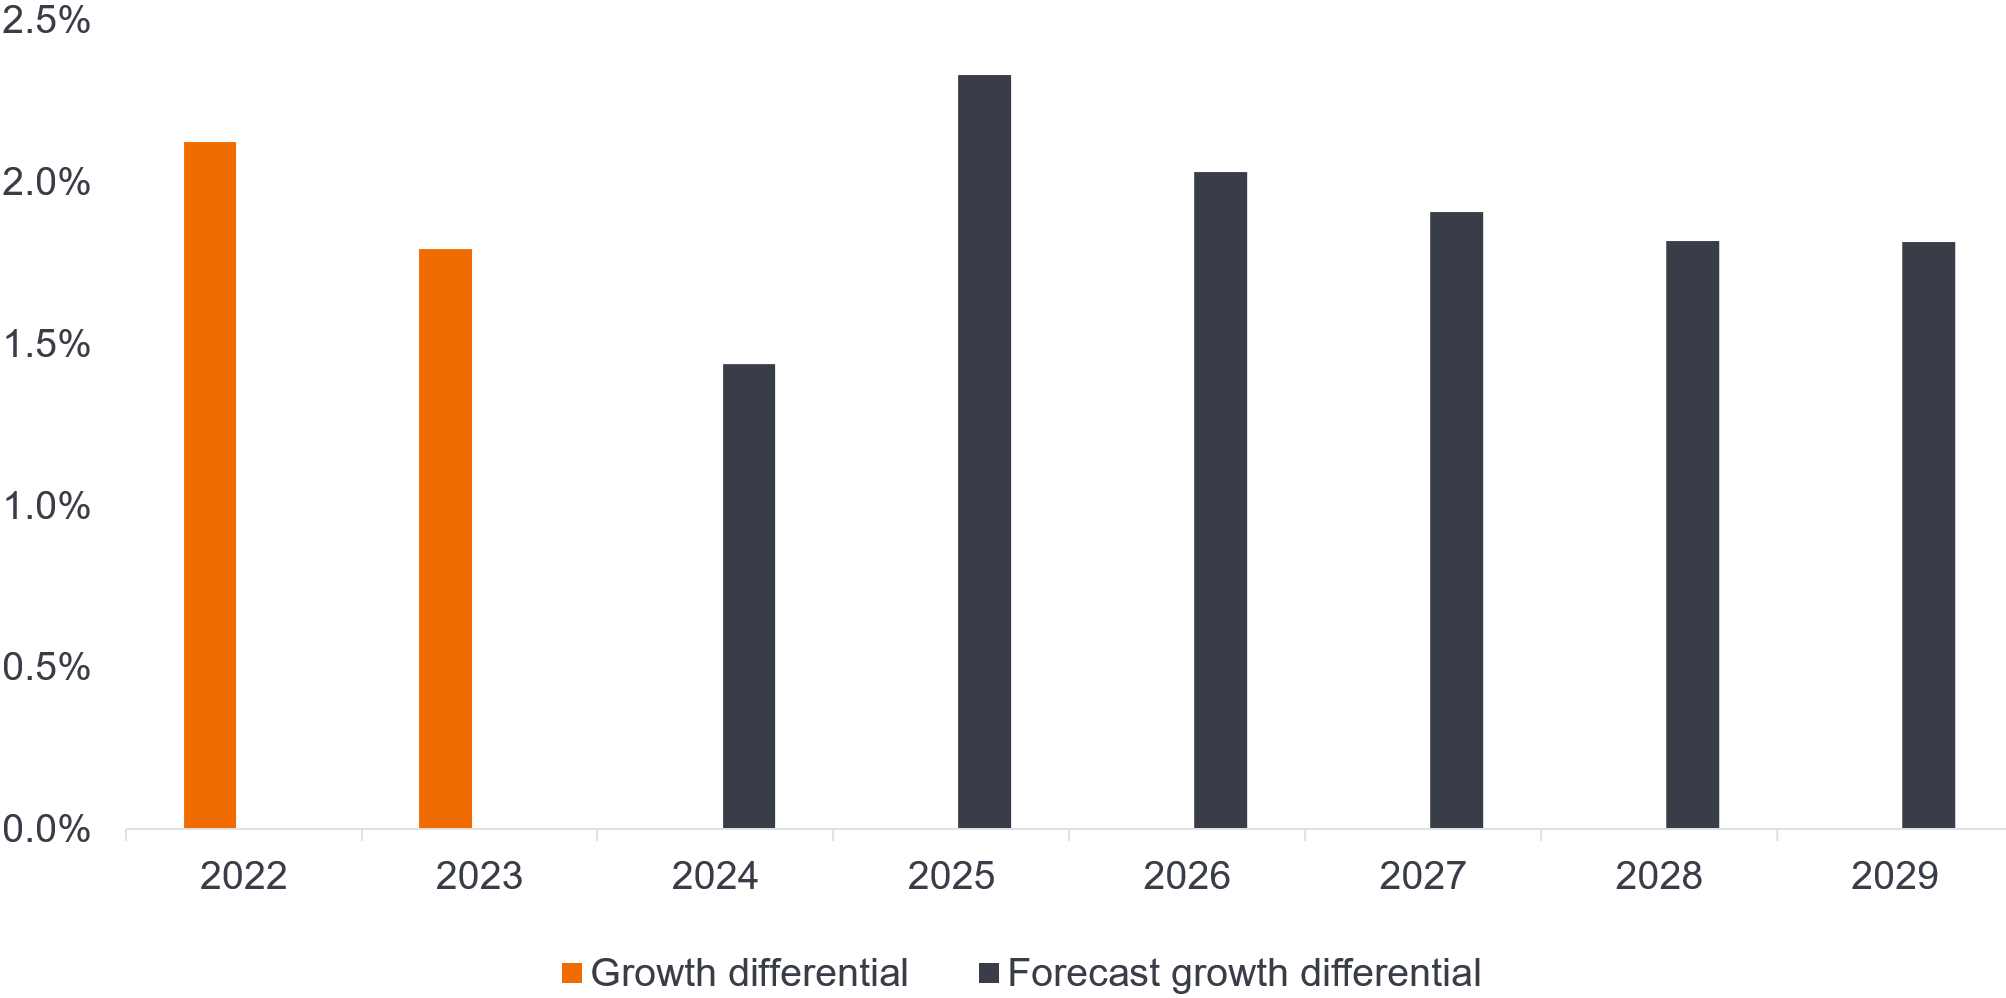
Source: IMF World Economic Outlook database, April 2024 (latest available data). Chart shows excess economic growth – current and forecast – for emerging and developing economies relative to that of the United States. Growth rate differential calculations are based on GDP, constant prices, percent change data. Over the forecast period (2024-2029), IMF figures show that, on average, growth in emerging and developing economies is expected to exceed that of the US by 1.9%. There is no guarantee that past trends will continue, or forecasts will be realised.
Clearly, one of the challenges going forward for all economies is that we are in a more indebted world. Within the EM universe, for example, some countries are still struggling with the aftermath of COVID-related spending. However, relative to the developed world (the US now spends approximately the same as the entire market cap of JP Morgan EMBI on interest costs every year, which is arguably not sustainable), EM debt metrics have begun to normalise. In aggregate, EM fiscal deficits are close to historical average again in EMBI-weighted terms. With ongoing fiscal consolidation in EM and advantageous structural factors such as better demographics, the EM/US growth differential rate post 2024 is likely to widen.
Overall credit quality improving. If you look at Figure 3, you can see a historical evolution of ratings upgrades and downgrades (excluding CCC-rated bonds). If you look at the last 4-5 years, what we’ve seen is a very negative adjustment during COVID. In 2023, however, there has been an improvement, with more upgrades than downgrades. So, having seen some recovery and stabilisation in EM, we are now seeing an improvement in the overall credit quality.5
Figure 3: A more balanced outlook
JP Morgan EMBI (ex CCC-rated issues) – Upgrades versus Downgrades
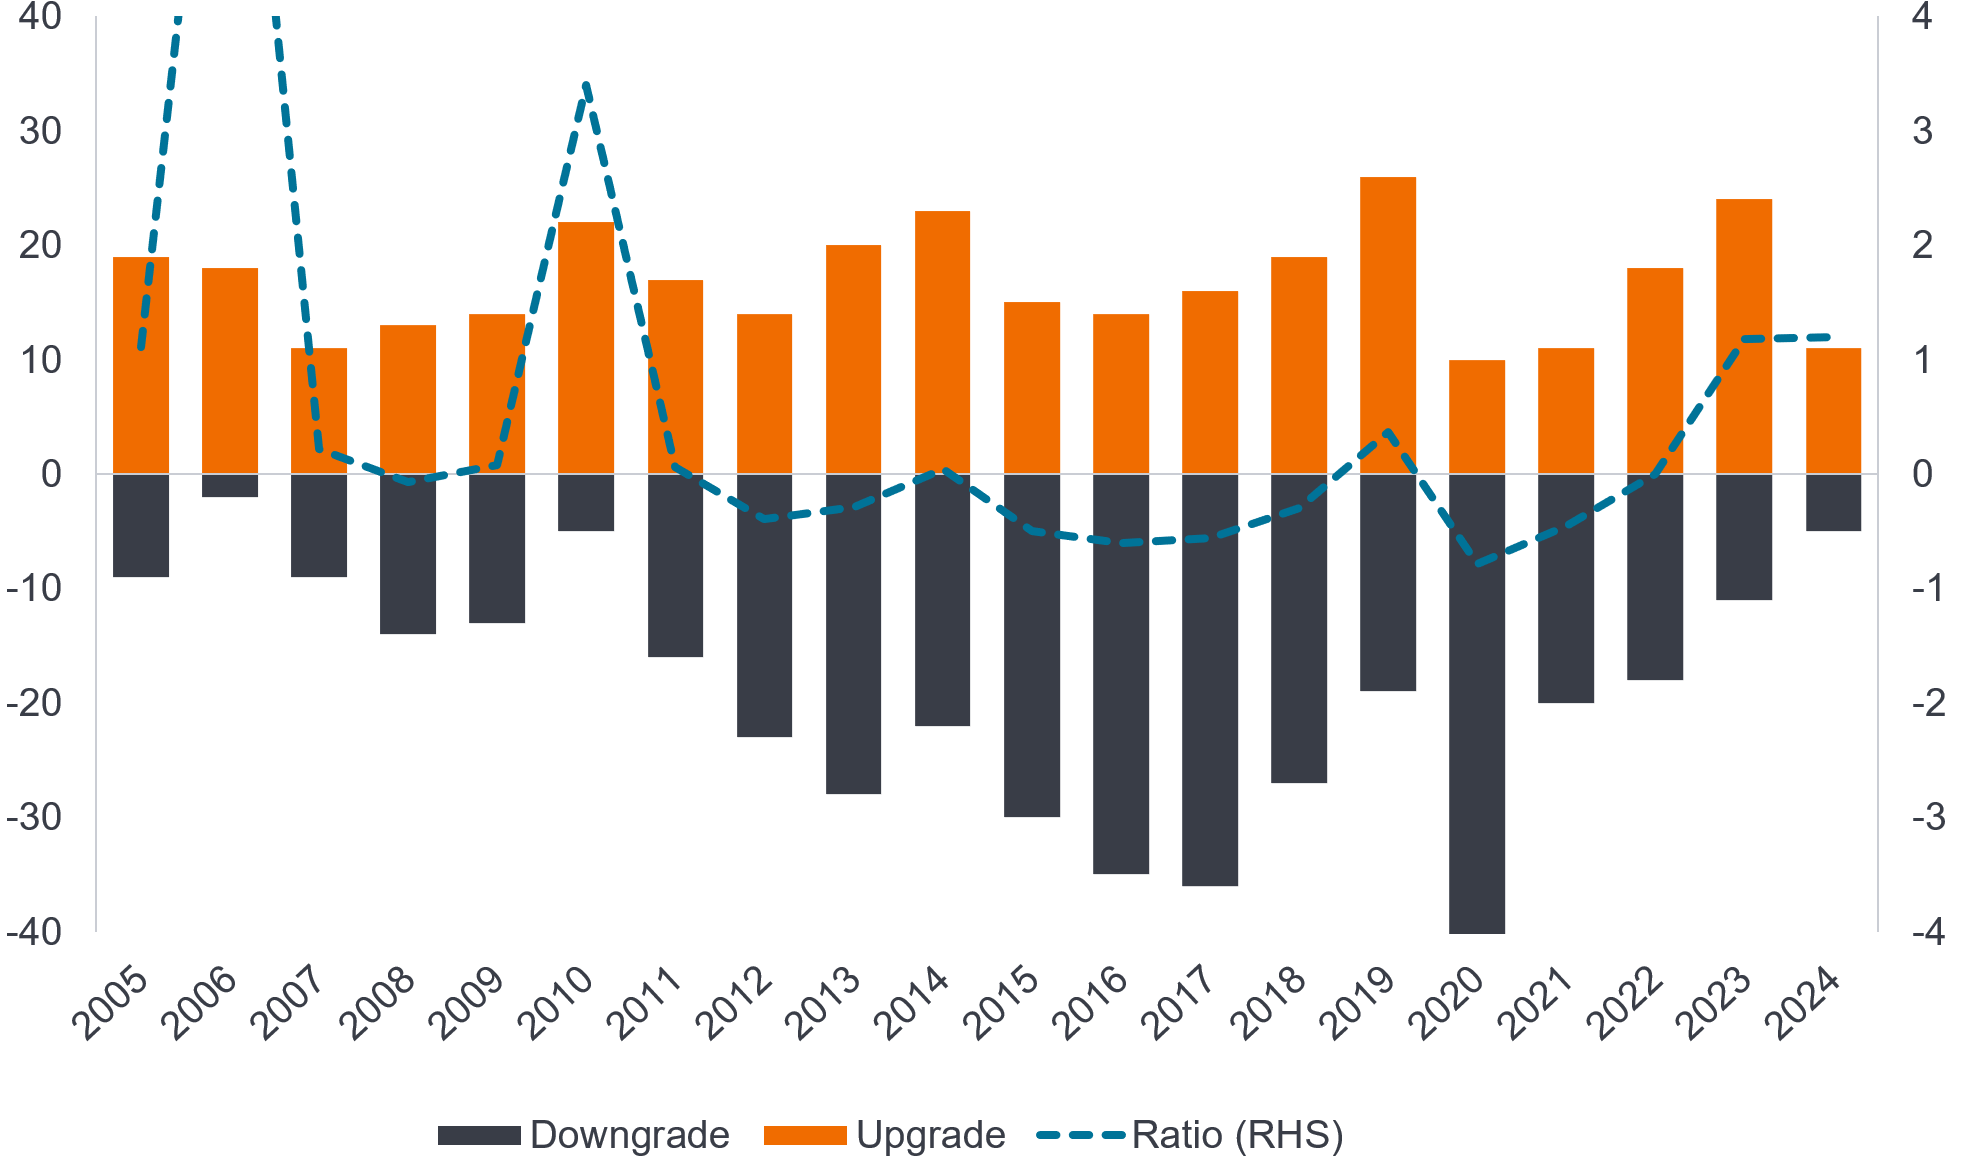
Source: Janus Henderson Investors, Macrobond as of 31 March 2024. There is no guarantee that past trends will continue, or forecasts will be realised.
The asset class has a “credit anchor”
EMDHC is a risky asset class and, as such, is subject in the near term to whatever drives global financial markets; be it EM specific shocks or non-EM specific shocks. Over the longer term, however, the asset class has a “credit anchor” that effectively limits the magnitude and longevity of drawdowns.
Let us explain this in more detail. In the short term, the asset class is hostage to near-term noise, making it difficult to navigate on a tactical basis. Thus, many investors see EMDHC as a strategic allocation.
Some of the near-term noise does impact fundamentals; some does not. What is important to understand is that if you believe in the underlying fundamentals, they are going to determine your investment outcome in the medium-to-long term.
Expressed differently, if you believe that the near-term noise does not significantly impact the willingness and ability of a country to service its debt, then what you effectively have is a “credit anchor” at the country level that eventually pulls down the “noisy” element of the risk premium (Figure 4).
Typically, what happens is that as countries continue to pay their coupons and the noisy global shocks dissipate over time, perceptions of market risk move back closer in line with underlying sovereign credit fundamentals. These periods of mis-pricings present opportunities for active investors with a solid understanding of credit fundamentals.
Figure 4: The importance of a “credit anchor”
JP Morgan EMBIGD ex-Russia spread over US Treasuries
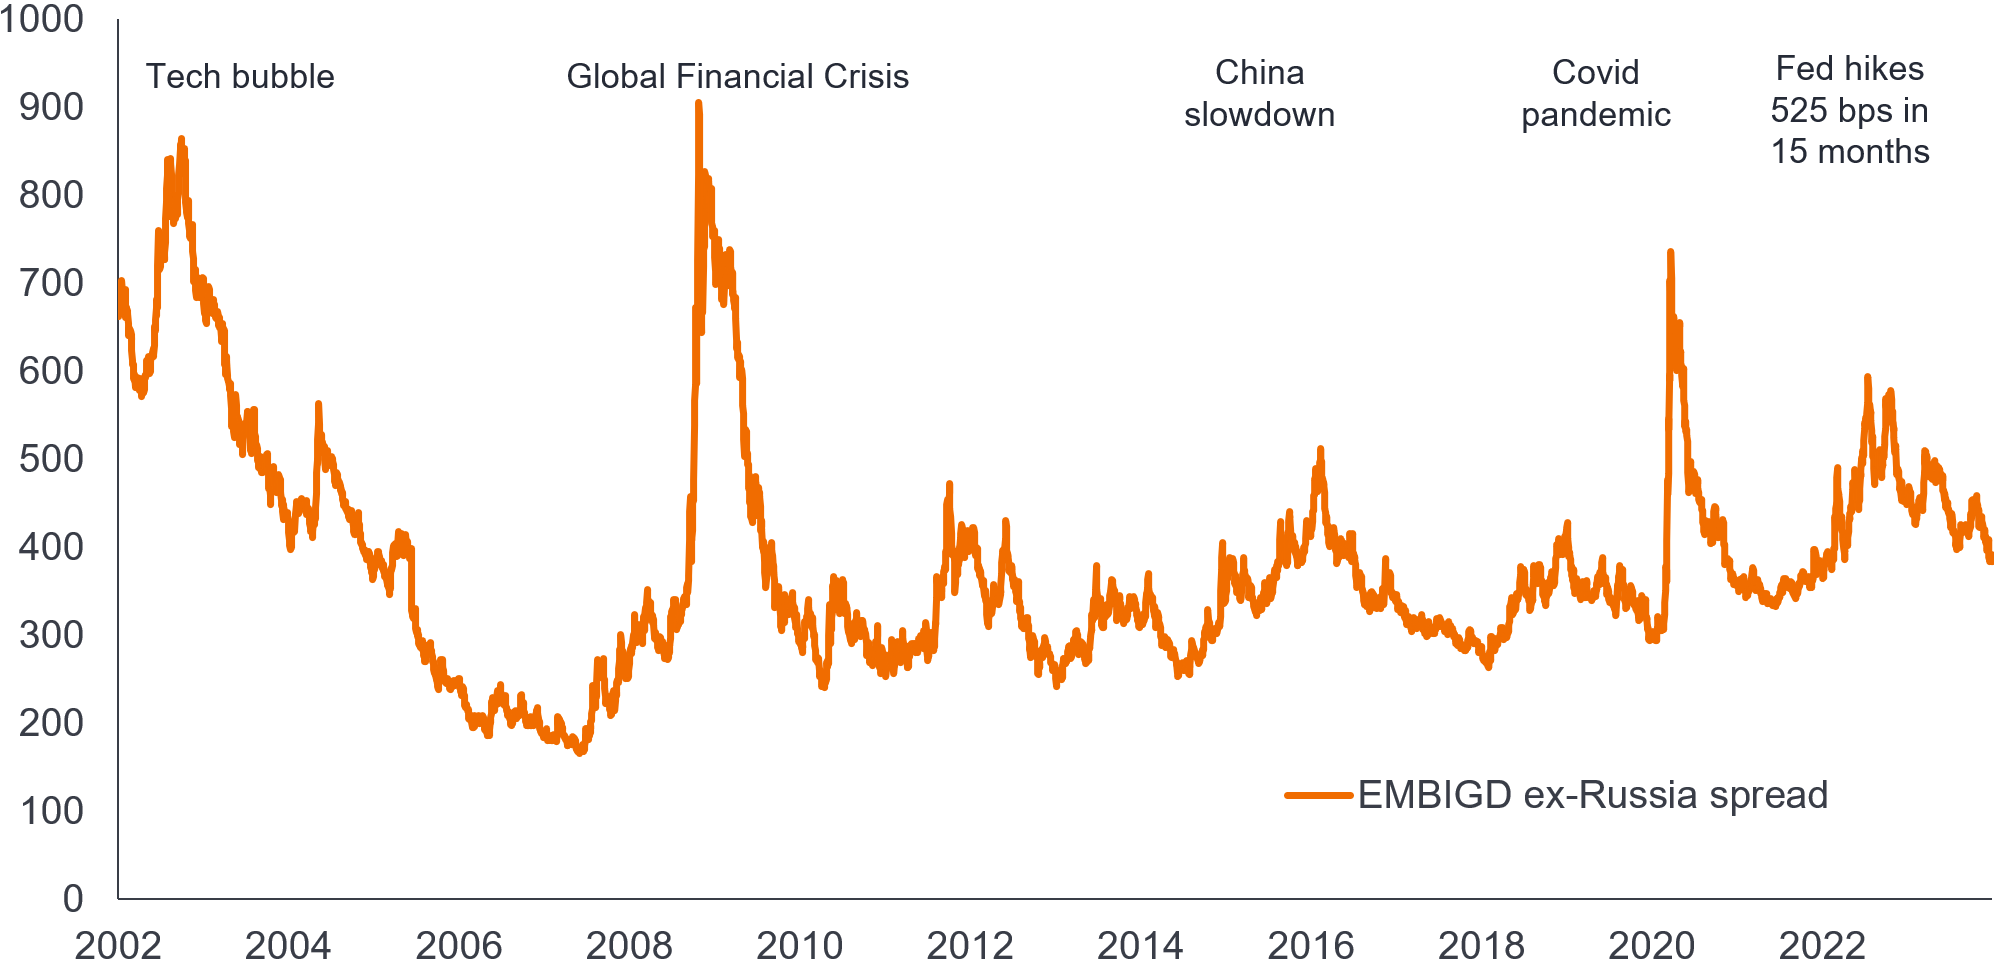
Source: Janus Henderson Investors, Thomson Reuters Datastream, J.P. Morgan, S&P. Data from 1 January 2002 to 29 December 2023. Past performance does not predict future returns.
Most of the shocks we have seen since the global financial crisis have been relatively short lived and without a lot of fundamental impact. The exception, of course, was COVID. Although relatively short-lived, COVID had a fundamental impact because fiscals and debt were significantly impacted, both in EM and developed markets (DM). Most often though, the shocks we’ve seen have been sufficiently short-lived to not have a credit relevant impact and interfere with the financing cycle of countries.
How we think about credit risk – and active management
What we find empirically is that there is a systematic relationship between official credit ratings and market behaviour (implied market rating) over time, with the implied market rating leading (i.e., anticipating) official ratings by 1-2 years.
Via active management, we believe there is an opportunity to capitalise on market overshoots and undershoots of this historically systematic relationship to generate alpha.
Figure 5 is a simple chart showing this systematic relationship, using Brazil as an example. The dark line is the official average credit rating for Brazil and the orange line is how the market is pricing credit risk in Brazil relative to other EM countries, which we call an implied market rating (IMR).
Figure 5: Sovereign credit risk has a core trend component
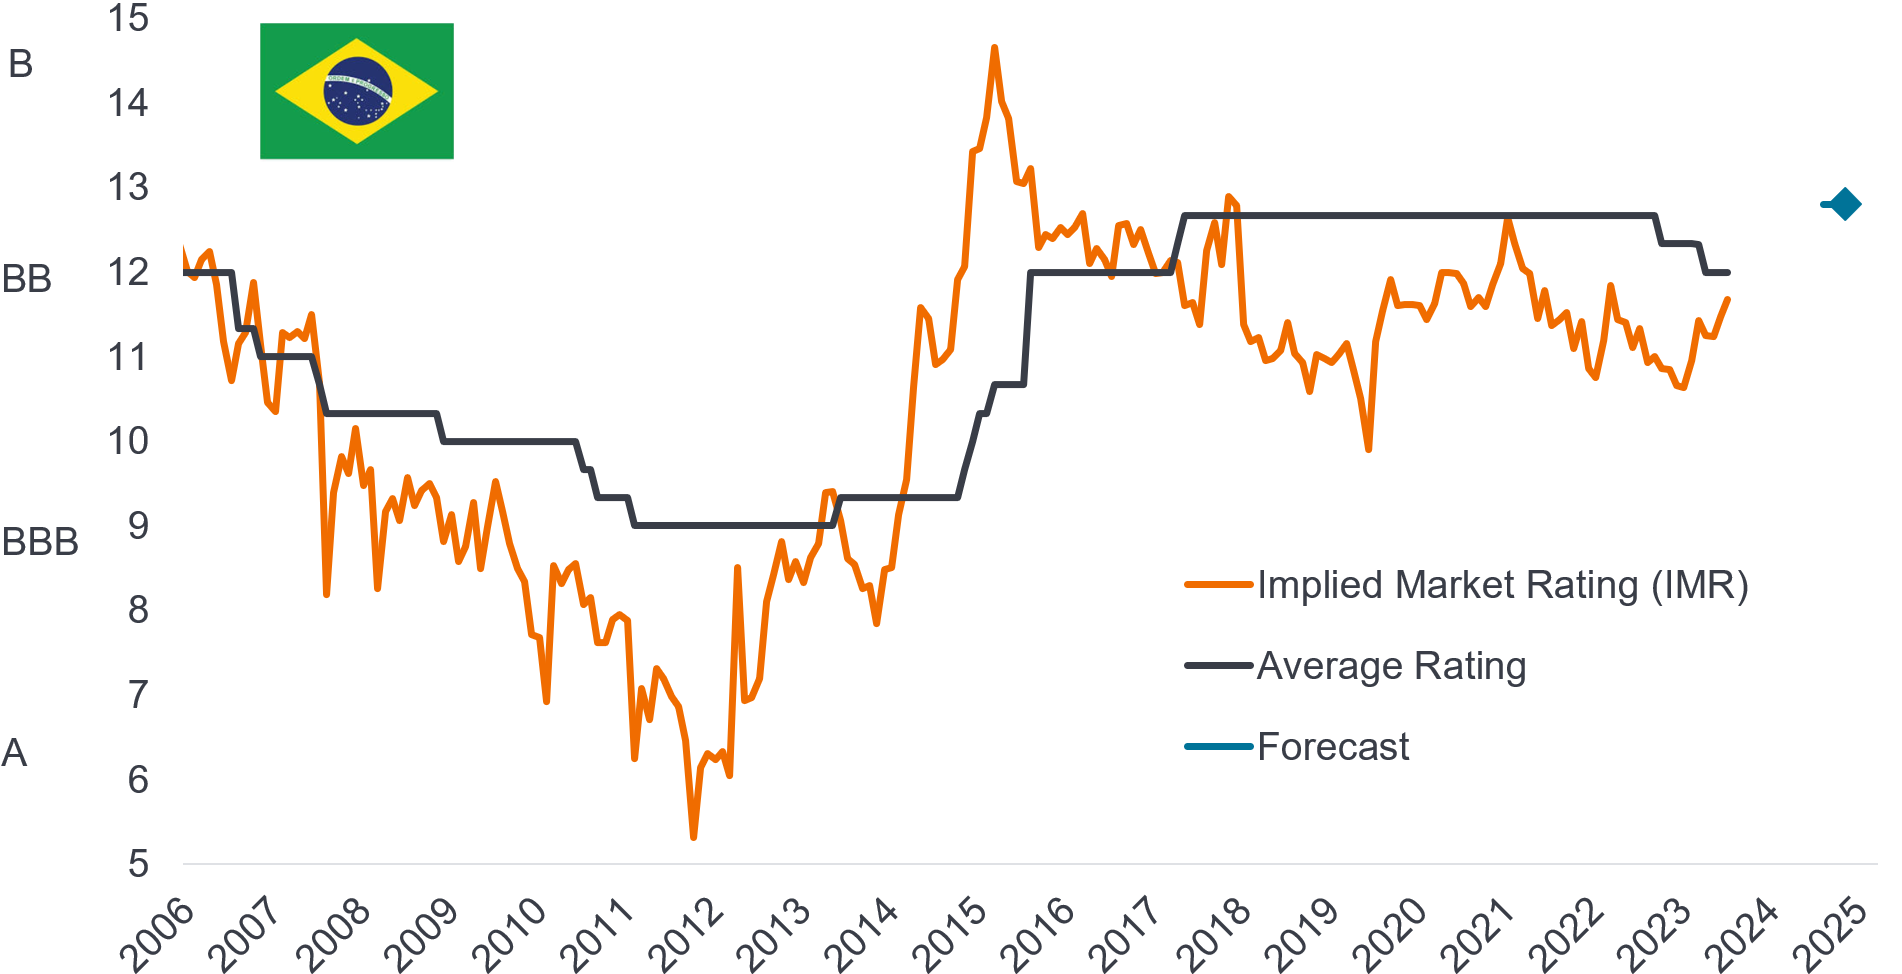
Source: Janus Henderson. Data is from 29 October 2004 to 30 April 2024. The Y axis numbers refer to notches. The blue forecast notch (12.8) relates to the period 31 May 2025 to 31 August 2025. There is no guarantee that past trends will continue, or forecasts will be realised.
Market pricing is clearly forward looking and is driven by expectations about ratings 1-2 years into the future. Interestingly, we see clear signs of behavioural inefficiencies in our market when ratings change direction. If a ratings story changes from being positive to neutral or negative to neutral, historically we have observed mis-pricings of around 1-2 notches in the upgrade stories and 2-3 notches in a downgrade process. It takes the market some time to figure out whether a rating story that is no longer positive is now neutral, or whether a rating story that is no longer negative is now neutral. This behaviour is also suggestive of herding or confirmation bias where investors look for information that confirms the past good or bad ratings trajectory.
What we do at Janus Henderson, based on our proprietary sovereign credit research framework, is to figure out where ratings are moving in the next 1 to 2 years, because that is what is going to anchor credit risk premia at the country level. This is a different school of investing as it focuses more on the trend-like behaviour of sovereign credit risk than the short-term fluctuations. Reducing the analytical frequency needed to process and assess sovereign credit risk has been important for us as a relatively nimble team.
Without going into detail about how we analyse sovereign credit risk, what is clear to us is that a slow-moving core component of credit risk exists, which we believe can be predicted. Central to this core feature – and sovereign credit risk itself – is governance. And highly correlated to the two different measures of governance that influence sovereign credit risk is, of course, the quality of economic policy and reform policies in general. Identifying what kind of policies will influence the market perception of sovereign credit risk and to what extent, is an essential part of our fundamental analysis.
Labelled bonds a small but growing universe
Labelled bonds are still a small component of the overall asset class, but it is growing (Figure 6). These bonds allow investors to target certain activities in the sustainability area.
Figure 6: Growth in labelled bonds
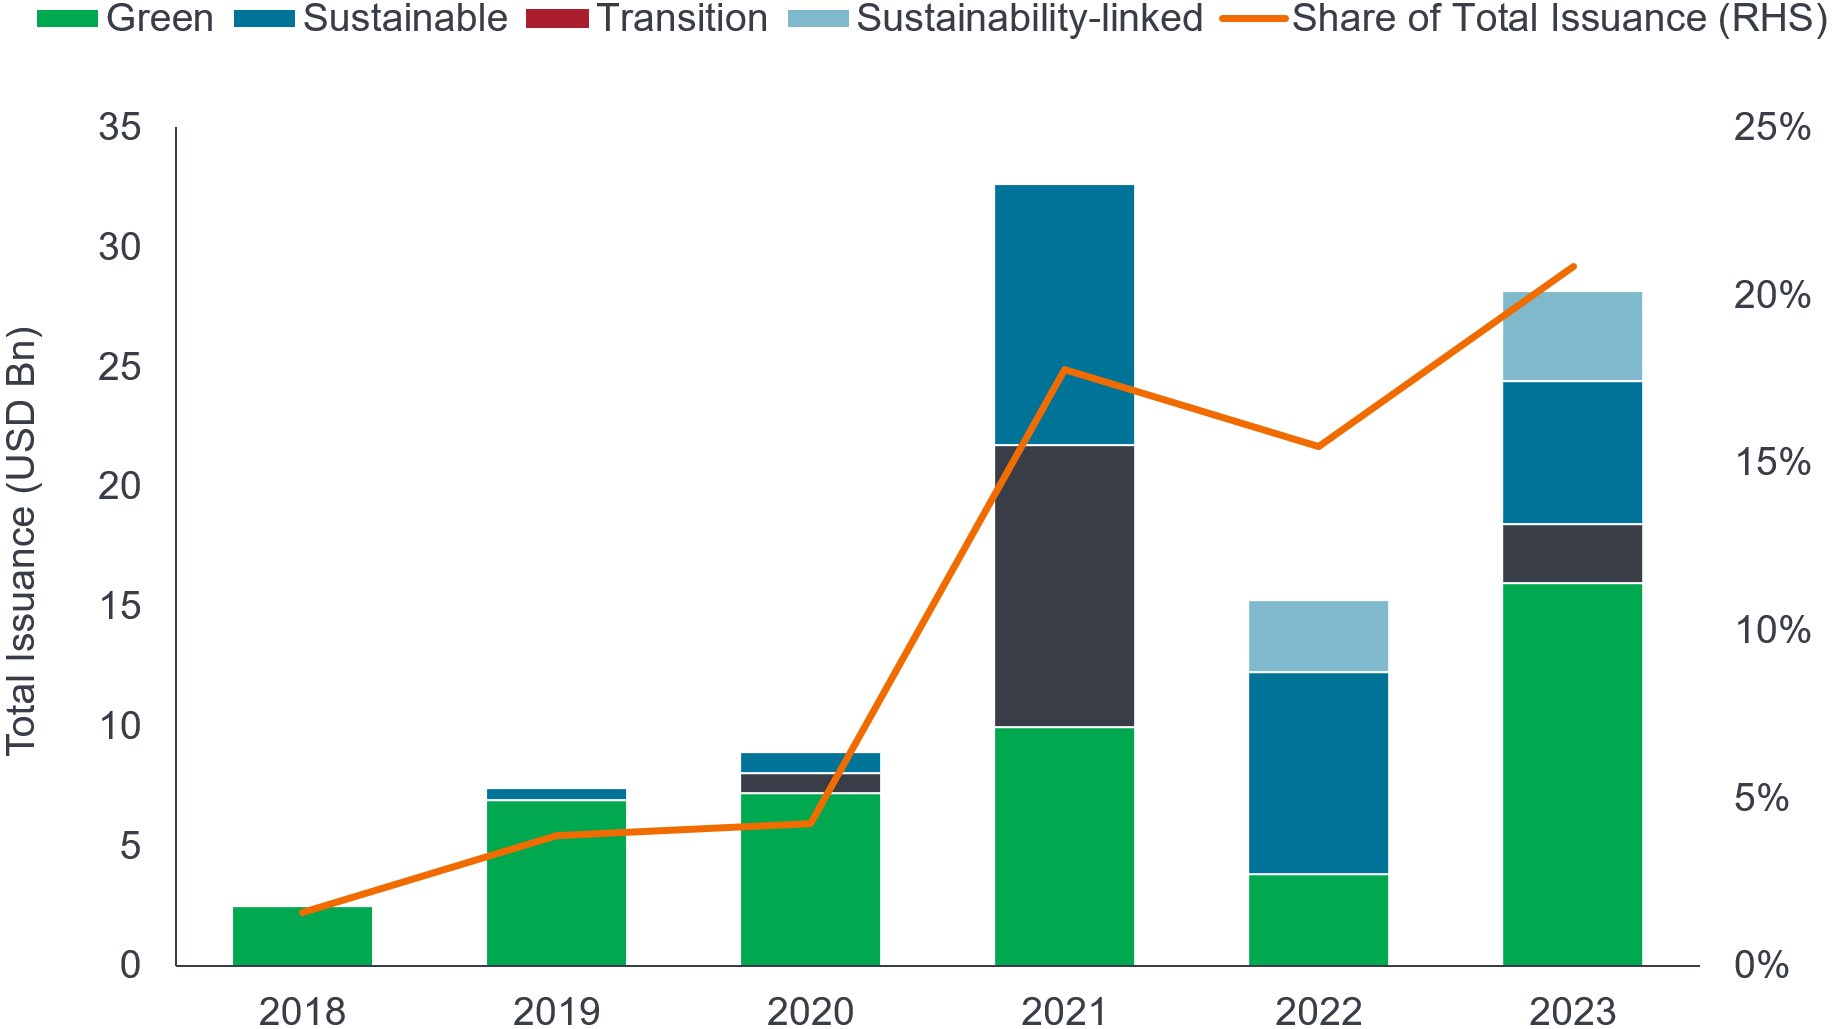
Source: Bond Radar, Bloomberg, Morgan Stanley Research, as of 31 December 2023.
To get a better sense of the purpose of labelled bonds, let us look at two recent issuances as examples. The first is Benin, which issued a €500 million Sustainable Development Goals (SDG) bond whose proceeds have been earmarked to four sustainability pillars: Population (agrobusiness and access to drinking water); Prosperity (improving access to low-carbon energy sources); Planet (biodiversity conservation and reforestation); and Peace (preservation of heritage sites). The second example is Uruguay, which issued a Paris-aligned US$1.5bn sovereign sustainability-linked bond (SLB). In this case, the coupon is directly linked to two Key Performance Indicators (KPIs). The first KPI is decreasing the country’s carbon intensity per unit of GDP. The second is protection of native forested areas.
At Janus Henderson, analysing ESG relevant factors has always been an integral part of our investment process. That notwithstanding, with the nascent growth of labelled bonds, it is becoming a bit easier to target investments specifically designed around specific ESG objectives.
Return expectations
The intersection of the X and Y axes highlighted in bold in Figure 7 gives you a sense of near-term return expectations. It is a very simple table that allows you to play around with the two factors that will determine your total return – spread and underlying US treasury yield. It shows the expected 1-year total return at a benchmark level as of 29 April 2024 (7.3%), and what happens to this return given a move in the underlying US Treasury yield, with the other axis constant, or what the total return might be given a change in the sovereign spread, with the Treasury yield remaining unchanged.
Figure 7: Estimated returns – yields provide a downside buffer
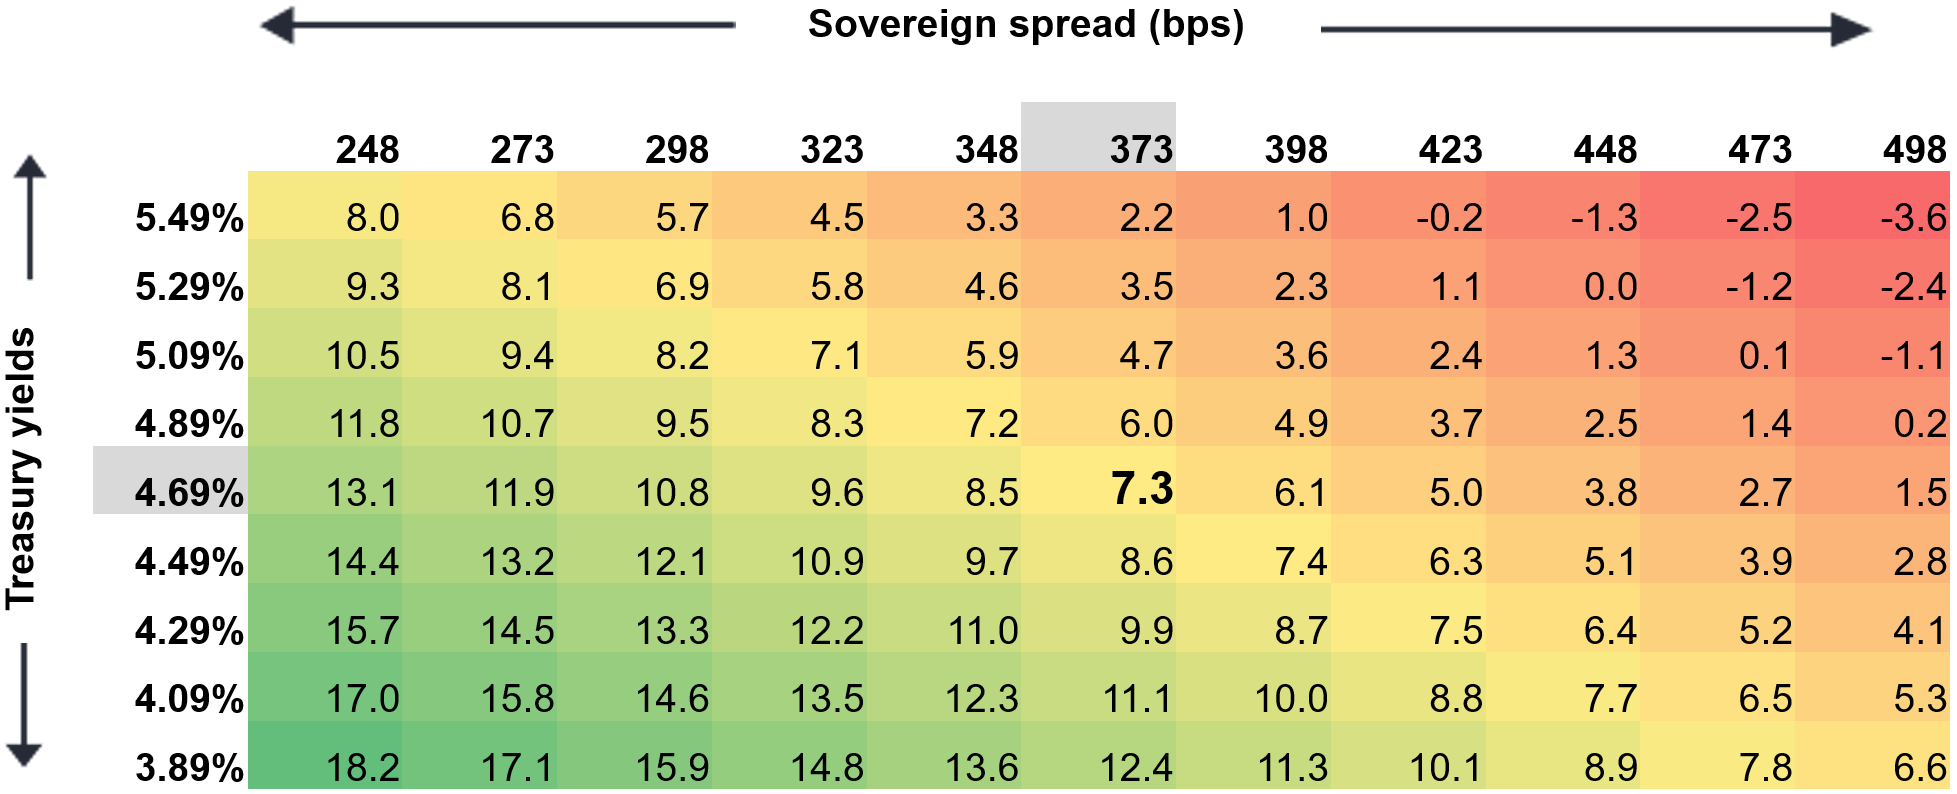
Source: Janus Henderson Investors, as of 29 April 2024. Treasury yields are US 10-year yields. For illustrative purposes. Yields may vary and are subject to change. Past performance does not predict future returns. There is no guarantee that past trends will continue, or forecasts will be realised.
An important point to make here is that over the last couple of years, a significant increase in US Treasury yields has coinciding with a significant increase in sovereign spreads. So, you had a positive correlation between the two because the shock was inflation.
Looking ahead, if you believe we are now transitioning into a more normal kind of economic cycle that is more growth focused than inflation focused – which is more normal – we would expect the correlation between Treasury yields and sovereign spreads to turn more negative. Of course, we also still need to see inflation continuing to come down. Overall, though, we believe there is now a bit more protection in the asset class from an overall higher yield and from a Treasury yield that has now priced in quite a lot of inflation.
Past performance is no guide to the future, but it may be of some comfort to highlight to asset owners who may be considering a strategic allocation to EMDHC that the asset class has a strong performance track record. Since the early 1990s, EMDHC has had one of the highest risk-adjusted returns among public fixed income asset classes.6
Final thoughts
The evolving EMDHC asset class represents a useful diversifying component to a broad-based portfolio – not only in terms of the breadth of underlying economic exposures and their growing significance to the global economy, but also in terms of their asynchronous position in the economic cycle relative to many developed countries. Further, the changing threats and opportunities for economies all over the globe (arising, inter alia, from a fragmented geopolitical environment and the gradual shift towards a more multi-polar world), calls, we believe, for diversified investments – and EMDHC is a very diversifying asset class.
Some parts of the EMDHC universe are still emerging from the inflation shocks that hit the global economy over the past couple of years. We are still working through some of the overhang from the policies implemented back in the COVID years and, more recently, the inflationary shock from the Russia-Ukraine war. The positive takeaway is that fiscal consolidation is taking place, credit quality is gradually improving at the aggregate level, and the EM-DM economic growth rate differential – an important element of the outlook for EMDHC – is set to move higher in favour of EM.
Sentiment on this asset is often dominated by news headlines (often negative) and there is a tendency to view exotic events in one or two countries (e.g., monetary policy decisions in Turkey) as typical of the whole. From our perspective, there are many good things happening in the asset class. Over the medium term, better policies are typically underestimated, and fundamentals are usually not as bad as some headlines suggest.
Over time, it is fundamental sovereign credit risk that counts. Near-term market noise will sometimes produce spikes in sovereign spreads, but spreads will soon re-anchor themselves lower in approximation with sovereign credit risk fundamentals, dampening the extent and duration of drawdowns in the asset class, except in less frequent cases where the shock has a more fundamental impact on a country.
This is an asset class that readily lends itself to active management. Markets moves have a systematic relationship to anticipated moves in credit quality but tend to overshoot on both the upside and downside. Active managers undertaking fundamental research can potentially deliver alpha by correctly identifying key points at which markets misprice anticipated moves in sovereign credit risk.
In terms of near-term performance, our view is that 2024 will continue to see attractive risk-adjusted returns. Clearly, spreads have tightened, leaving less room for additional tightening, but overall yields remain high in a historical perspective, presenting an opportunity in an asset class that is fundamentally improving. Further, with policy rates in key western developed markets likely having peaked, this represents a positive for the asset class as, historically, the two years following a pivot in the rate cycle in the US have been positive for EMDHC returns. In our view, attractive yields/carry offer a buffer against spread widening and will likely constitute the lion’s share of the attractive total returns we envisage for 2024.
1 In this article, we sometimes refer to the JP Morgan Emerging Markets Bond Index Global Diversified (EMBI Global Diversified, or EMBIGD) and sometimes we refer to the JP Morgan Emerging Bond Index Global (EMBI Global, or just EMBI for short). The countries covered in EMBIGD are identical to those covered in EMBI Global. The sole difference is the country weightings. EMBIGD is a uniquely weighted version of EMBI Global. It limits the weights of those index countries with larger debt stocks by only including specified portions of these countries’ eligible current face amounts of debt outstanding.
2 Source: JP Morgan Emerging Markets Bond Index (EMBI) Monitor, April 2024 month end highlights.
3 The market cap of EM sovereign bonds is US$1,5 trillion and 100% owned quasi sovereign is US$0.7 trillion, according to JP Morgan’s April 2024 Emerging Markets Corporates publication. The size of the US High Yield market, as represented by the ICE BofA US High Yield Index, is US$1.26 trillion as of 23 May 2024 (Source: Bloomberg).
4 Source: JP Morgan Emerging Markets Bond Index (EMBI) Monitor, April 2024 month end highlights.
5 Financial media outlets are beginning to pick up on this shift. Here’s a link to a Reuters article dated 22 May 2024 that includes a number of upbeat comments from credit ratings agencies. (https://www.reuters.com/markets/emerging-market-credit-ratings-are-finally-looking-up-again-2024-05-22/)
6 According to an analysis by JP Morgan in September 2020, in a paper titled “EM as an Asset Class in the Post-pandemic World”, EM sovereign credit has historically had high Sharpe ratios (comparable to US high yield), putting it on the efficient frontier of global asset classes with higher returns. According to the JP Morgan analysis, “a key driver of the higher Sharpe ratios in EM credit has been the diversification that credit assets have with a risk premia that tends to overcompensate for losses along with a risk-free component of US rates exposure”. In a similar vein, a July 2023 paper by Bank of America Global Research, “The Emerging Markets Debt Primer, 2023”, states that “emerging markets external debt has produced one of the highest returns among major asset classes for a long time”. Comparing the total return performance of the JP Morgan EMBI Global Diversified Composite Index since inception in December 1993 to the performance of the ICE BofA US Cash Pay High Yield Index and the ICE BofA US Treasury Index, the paper states that: “For almost three decades, returns for the asset class (i.e., EM external debt) have exceeded other major fixed income markets with a cumulative return of over 800%” (or 7.4% annualised).
Basis point (bp). One basis point equals 1/100 of a percentage point. 1 bp = 0.01%, 100 bps = 1%.
Credit metrics. Numerical representations of a borrower’s financial stability and creditworthiness. Examples include a credit score, a debt-to-income ratio, an interest coverage ratio and a credit utilisation ratio.
Credit risk. The risk that a borrower will default on its contractual obligations to make the required interest payments or repay the loan. Anything that improves conditions for a company can help to lower credit risk.
Dispersion. Dispersion, also called variability or scatter, is the extent to which numerical data varies, or is likely to vary, about an average value.
Diversification. A way of spreading risk by mixing different types of assets/asset classes in a portfolio, on the assumption that these assets will behave differently in any given scenario. Assets with low correlation should provide the most diversification.
Emerging market. The economy of a developing country that is transitioning to become more integrated with the global economy. This can include making progress in areas such as depth and access to bond and equity markets and development of modern financial and regulatory institutions.
Eurobond. A bond denominated in a currency not native to the country where it is issued.
Fiscal policy. Connected with government taxes, debts and spending. Government policy relating to setting tax rates and spending levels. It is separate from monetary policy, which is typically set by a central bank. Fiscal austerity refers to raising taxes and/or cutting spending in an attempt to reduce government debt. Fiscal expansion (or ‘stimulus’) refers to an increase in government spending and/or a reduction in taxes.
FX. Foreign exchange.
Geopolitics. Politics, especially international relations, influenced by geographical factors.
GDP. The value of all finished goods and services produced by a country, within a specific time period (usually quarterly or annually). It is usually expressed as a percentage comparison to a previous time period and is a broad measure of a country’s overall economic activity.
Debt-to-GDP ratio. The debt-to-GDP ratio is the metric comparing a country’s public debt to its gross domestic product (GDP).
High yield bond. A bond with a lower credit rating than an investment grade bond, also known as a sub-investment grade bond, or ‘junk’ bond. These bonds usually carry a higher risk of the issuer defaulting on their payments, so they are typically issued with a higher interest rate (coupon) to compensate for the additional risk.
International Monetary Fund (IMF): The IMF is a global organization that works to achieve sustainable growth and prosperity for all its 190 member countries. It does so by supporting economic policies that promote financial stability and monetary cooperation, which are essential to increase productivity, job creation and economic well-being. The IMF is governed by and accountable to its member countries.
Investment grade. Debt issued by governments or companies perceived to have a relatively low risk of defaulting on their payments, reflected in the higher rating given to them by credit ratings agencies.
JP Morgan EMBI Global Diversified Index (EMBIGD). A widely used benchmark, or investable universe proxy, for hard currency emerging market debt. This index tracks liquid US dollar emerging market fixed and floating-rate debt instruments issued by sovereign and quasi-sovereign entities.
JP Morgan Government Bond Index-Emerging Markets (GBI-EM). A widely used benchmark, or investable universe proxy, for emerging market debt issued in local (domestic) currency.
Monetary policy: The policies of a central bank, aimed at influencing the level of inflation and growth in an economy. It includes controlling interest rates and the supply of money. Monetary stimulus refers to a central bank increasing the supply of money and lowering borrowing costs. Monetary tightening refers to central bank activity aimed at curbing inflation and slowing down growth in the economy by raising interest rates and reducing the supply of money.
MOVE Index. The MOVE index, short for “Merrill Option Volatility Estimate Index,” is a measure of expected short-term volatility in the US Treasury bond market.
Multilateral Development Bank (MDB). A supranational financial institution established by multiple member countries to facilitate low-cost financing to developing countries with a view to fostering economic and social progress. MDBs also provide advisory services to developing countries. MDBs are sometimes also referred to as International Financial Institutions (IFIs). MDBs also play a major role in international capital markets, where they raise the large volume of funds required to finance their loans. Major MDBs include the European Investment Bank, the International Bank for Reconstruction and Development (World Bank Group), the Asian Development Bank, the International Development Association (World Bank Group), the Inter-American Development Bank, the European Bank for Reconstruction and Development, the African Development Bank, the Asian Infrastructure Investment Bank, the Islamic Development Bank, the Central American Bank for Economic Integration, and the New Development Bank.
Notches/notching. A notch is a discrete rating level. Notching is used to evaluate the relative credit risk of bond and debt issuers. A notch downgrade means a reduction in a long-term rating evidenced by the removal or substitution of a modifier or numerical qualifier. For example, a downgrade from A- to BBB+ is a one notch downgrade, as is a downgrade from BBB+ to BBB. Similarly, a downgrade from A3 to Baa1 or from Baa1 to Baa2 is one notch downgrade.
Percentile. A statistical measure to express where an observation falls in a range of other observations. A 90th percentile data point, for example, is the value below which 90% of data points fall.
Purchasing Managers’ Index (PMI). An indicator of the economic health of the manufacturing sector. A reading of 50 indicates no change in the environment. A reading above 50 indicates sectoral expansion; below 50 indicates contraction.
Quasi sovereigns. Quasi sovereigns are entities (including a local or regional governmental body) that are 100% guaranteed by a sovereign or are more than 50% directly owned or controlled by a sovereign. Quasi sectors are mainly in oil & gas, but also in metals & mining, utilities and finance.
Sustainable Development Goals (SDGs). Adopted by United Nations members is 2015, the UN describes the 17 SDGs (otherwise known as the Global Goals) as “a shared blueprint for peace and prosperity for people and the planet, now and into the future”.
Volatility. The rate and extent at which the price of a portfolio, security or index, moves up and down. If the price swings up and down with large movements, it has high volatility. If the price moves more slowly and to a lesser extent, it has lower volatility. The higher the volatility the higher the risk of the investment.
These are the views of the author at the time of publication and may differ from the views of other individuals/teams at Janus Henderson Investors. References made to individual securities do not constitute a recommendation to buy, sell or hold any security, investment strategy or market sector, and should not be assumed to be profitable. Janus Henderson Investors, its affiliated advisor, or its employees, may have a position in the securities mentioned.
Past performance does not predict future returns. The value of an investment and the income from it can fall as well as rise and you may not get back the amount originally invested.
The information in this article does not qualify as an investment recommendation.
There is no guarantee that past trends will continue, or forecasts will be realised.
Marketing Communication.
Important information
Please read the following important information regarding funds related to this article.
- An issuer of a bond (or money market instrument) may become unable or unwilling to pay interest or repay capital to the Fund. If this happens or the market perceives this may happen, the value of the bond will fall. High yielding (non-investment grade) bonds are more speculative and more sensitive to adverse changes in market conditions.
- When interest rates rise (or fall), the prices of different securities will be affected differently. In particular, bond values generally fall when interest rates rise (or are expected to rise). This risk is typically greater the longer the maturity of a bond investment.
- Some bonds (callable bonds) allow their issuers the right to repay capital early or to extend the maturity. Issuers may exercise these rights when favourable to them and as a result the value of the Fund may be impacted.
- Emerging markets expose the Fund to higher volatility and greater risk of loss than developed markets; they are susceptible to adverse political and economic events, and may be less well regulated with less robust custody and settlement procedures.
- The Fund may use derivatives to help achieve its investment objective. This can result in leverage (higher levels of debt), which can magnify an investment outcome. Gains or losses to the Fund may therefore be greater than the cost of the derivative. Derivatives also introduce other risks, in particular, that a derivative counterparty may not meet its contractual obligations.
- When the Fund, or a share/unit class, seeks to mitigate exchange rate movements of a currency relative to the base currency (hedge), the hedging strategy itself may positively or negatively impact the value of the Fund due to differences in short-term interest rates between the currencies.
- Securities within the Fund could become hard to value or to sell at a desired time and price, especially in extreme market conditions when asset prices may be falling, increasing the risk of investment losses.
- The Fund may incur a higher level of transaction costs as a result of investing in less actively traded or less developed markets compared to a fund that invests in more active/developed markets.
- Some or all of the ongoing charges may be taken from capital, which may erode capital or reduce potential for capital growth.
- CoCos can fall sharply in value if the financial strength of an issuer weakens and a predetermined trigger event causes the bonds to be converted into shares/units of the issuer or to be partly or wholly written off.
- The Fund could lose money if a counterparty with which the Fund trades becomes unwilling or unable to meet its obligations, or as a result of failure or delay in operational processes or the failure of a third party provider.
Specific risks
20 minute read
Key takeaways:
- Emerging Markets Debt Hard Currency (EMDHC) is a continually evolving, diversified asset class; one that is arguably too big to ignore (almost twice the size of the US high yield market) and representing more than 40% of global GDP as well as 80% of the global population. Over the medium term, EMDHC had one of the highest risk-adjusted returns among public fixed income asset classes.
- Policy improvements in emerging markets tend to be underappreciated by investors over the medium term. Further, country fundamentals for weaker countries are typically not as bad as some headlines might suggest.
- Within EMDHC, what matters is sovereign credit risk. There exists a systematic relationship between market movements and anticipated country credit ratings, and sovereign credit risk represents a slow-moving core component of the asset class that can be modelled to forecast country ratings. Investors should look past near-term market noise and understand that EM sovereign credit has an “anchor” that helps limit the size and length of drawdowns versus other EM asset classes.
Related insights


