
Key takeaways:
- The generative AI wave will last for multiple years because of the level of investment required, with multiple up and down periods, and hype cycles.
- The characteristics of the tech sector lend to the merits of investing in an actively-managed fund versus selecting individual stocks.
- Active management, guided by fund managers with extensive experience of navigating previous technology waves, enables better identification of potential winners, particularly with the return of cost of capital in this ‘winner takes most’ industry. This makes active management a strategic choice to navigate this highly complex landscape.
Technology stocks’ outsized returns over the past ten years,1 coupled with generative AI promising a myriad of investment opportunities, has led investors to pile into tech stocks, often using leverage (debt). But it also means concentration risk has significantly risen in a few names (Magnificent 7). This heightened market volatility is causing more dislocation of share prices from company fundamentals and highlights the need to be selective. These are just some of the reasons why compared to individual stock picking, we believe an active technology fund managed by an experienced investment team can enhance returns and reduce risk.
4 reasons for active management in tech
The unique characteristics of the tech sector highlight why investing via an actively-managed fund makes sense:
1 High growth – the assessment and valuation of tech companies is challenging due to their high growth potential and often intangible assets. Experience and expertise is needed.
2 Highly disruptive – an active risk aware, stock-picking approach enables the identification of companies that are likely to be disruptors rather than those being disrupted.
3 High volatility – active managers can identify valuation versus fundamentals disconnects, typical in a fast-moving, innovative sector.
4 High risk – active managers can employ portfolio diversification to reduce downside and concentration risk. Consideration of sustainability factors and company engagement can also enhance valuations, reduce risk and help future proof a company.
We can better illustrate the merits of investing via an active dedicated tech fund by talking through how we approach investing in generative AI.
Gen AI: not just a theme
Our experience of successfully navigating through previous tech waves like the PC and mobile internet tells us that generative AI is a true technology wave, because the cost curve of adoption is being structurally flattened. A huge amount of infrastructure has to be built out because gen AI isn’t a single product. We see gen AI as having multiple investment layers; this is important because we need to think about where we are in the tech adoption hype cycle, how long it will last and how to invest in it.
Figure 1: Compute waves have lasting effects
What we can learn from past waves

Source: Janus Henderson Investors, Bloomberg, as at 31 December 2024. S&P 500 Information Technology Index. Returns shown in USD. Max drawdown is the maximum observed loss measured by the highest and lowest price of a portfolio or security during a specific period. Past performance does not predict future returns.
In the third wave – the mobile internet wave, there were over six years of strong double-digit returns (Figure 1). But significant volatility accompanied these strong returns. Looking at the third wave, even when returns were up by more than 60%, there were double-digit drawdowns. The key is knowing when you have a drawdown, and identifying when there’s a significant price dislocation.
The fourth wave, the gen AI wave is only moving into its third year (since ChatGPT’s launch in November 2022), and we’ve already seen a significant drawdown. This is when you find the leaders and losers. This wave is set to last for multiple years due to the level of investment required, and will see multiple up and down periods. Looking back at the second wave, the initial area of investment was in silicon (semis), with companies like Intel and AMD driving that first cost down in Silicon Valley.
Similarly, in this fourth wave, NVIDIA as well as companies like Broadcom are the bedrock of the AI ecosystem. The first layer is the building of the physical infrastructure (GPUs, data centres, etc) and the foundational models (ChatGPT, large language models etc). Next comes the platforms – the GPUs need to connect with the data centre via networking, and then much higher speed connectivity is needed to connect them to the last mile user.
The second layer, AI platforms, are starting to emerge now. Typically these look to be the cloud platforms/hyperscalers that have the balance sheet strength to invest, but also because they’re involved in every single layer, hence can offer a full stack solution. We’re starting to look to transition from semiconductors to networking and other areas that will benefit in this second phase. The last phase will be the most exciting, the application and software layers, which is likely to be a good few years out from now. Our team is deliberating on what the time scale for this to start playing out might look like. To what degree can it be very easily upgraded on to an existing offering? To what extent does there have to be training to the end user to be able to do this? Remember that Uber launched in 2009 but didn’t have its IPO until 2019 to become a viable investment.
What’s the benefit of investing in tech stocks through a fund?
In investing, just as in baseball, to put runs on the scoreboard, one must watch the playing field, not the scoreboard.”
— Warren Buffett
Tech waves are complex to navigate, and take years to play out. Here, we use generative AI to illustrate the reasons why a fund approach has advantages over simply picking tech stocks.
1 Navigating the hype cycle and sustainability considerations
Identifying companies with a sustainable competitive moat and strong growth potential with rational valuations is essential to benefit from the generative AI wave. Maintaining a strong valuation discipline is key as investors often get overexcited about the pace of new technology adoption. Lots of capital comes in and then it unwinds. We’ve seen this through 3D printing, the internet bubble, and ultimately we will see this through AI. The magnitude of capital spending for gen AI looks to surpass previous waves given its potentially wider ability to disrupt the economy and impact supply chains, costs and competition. We believe active management is also key as it facilitates the consideration of financially material sustainability factors, this involves communicating views to companies and seeking improvements in performance and standards of corporate responsibility.
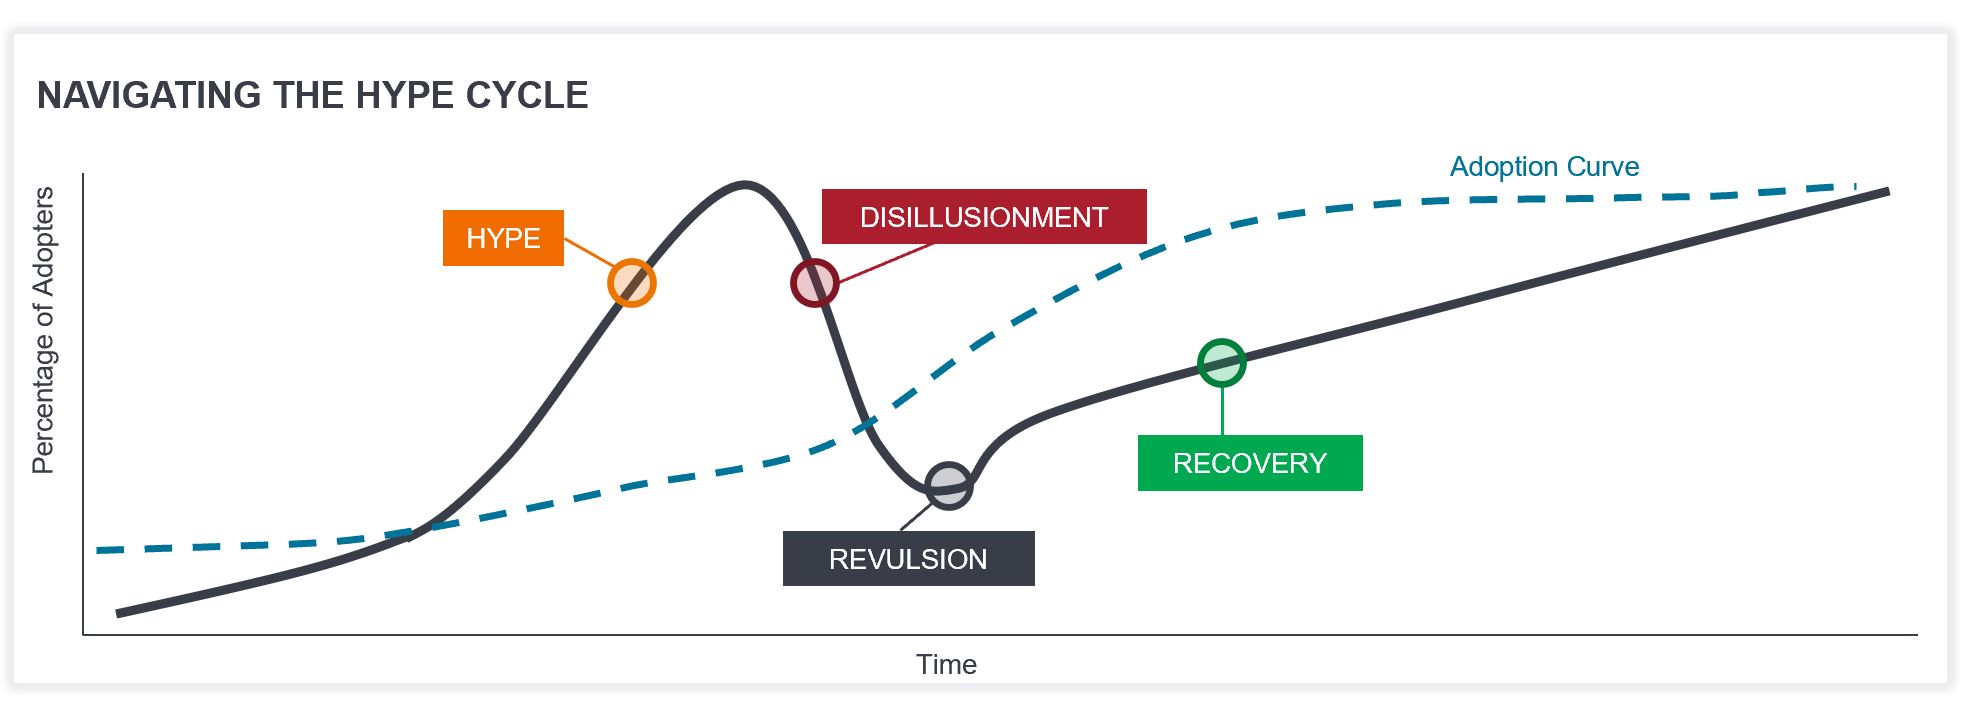
Figure 2 illustrates the stages of the hype cycle of new technology and how it aligns with tech adoption. We use the hype cycle adoption curve to guide us in our thinking and decisions; history has shown us adoption is always much broader than initially thought. You have to identify those strong long-term themes, understand the path of the waves, and then integrate sustainability factors using a financial materiality lens, which supports a company’s success in the long term. Gen AI, with its multiple investment layers, will see each layer having its own hype cycle, with each generating risks and opportunities to navigate.
Figure 2: Navigating the hype cycle
Note: Investing involves risk, including the possible loss of principal and fluctuation of value.
2 Size is not a stock picking strategy in technology
Selecting stocks by size is not a strategy for stock picking. Technology is a scale market. So while you can simply buy the top ten largest stocks in an index, it would be a huge mistake to not invest in some of those winners absent in that top ten. Looking back ten years ago, the top ten holdings in 2014 and the following ten years, only three of those stocks relatively outperformed, but they did so spectacularly (Figure 3).
Looking back between 1990 and now (Figure 3, table on the right), for companies that had hit market cap of US$1 trillion, 100 billion, 10 billion, 1 billion, buying each company that hit US$1 trillion, you would have doubled your money the fastest, with an 80% probability of achieving that. Whereas if you bought small caps at US$1 billion, you only had a 47% chance of capturing a stock that would double. So active management means not just owning all of the top ten, and it doesn’t mean abandoning all of the leaders that will be crucial to the success of the gen AI wave, because you could miss out on some of the strongest returns.
Figure 3: A time for active management
Technology sector: size is not a stock picking strategy

Source: (LHS) Janus Henderson Investors, Bloomberg, as at 31 August 2024. Performance in USD. *Total exposure to issuer includes multiple share classes. **Relative performance is based on an arithmetic calculation to MSCI ACWI Information Technology for the period 10 years to 31 August 2024. (RHS) Bernstein, 14 August 2024. Starting universe is largest 1500 US stocks, classified as Technology or Communications by GICS. Time taken to double from 1990 to 2024. References made to individual securities do not constitute a recommendation to buy, sell or hold any security, investment strategy or market sector, and should not be assumed to be profitable. Janus Henderson Investors, its affiliated advisor, or its employees, may have a position in the securities mentioned. Allocations are subject to change without notice. Past performance does not predict future returns.
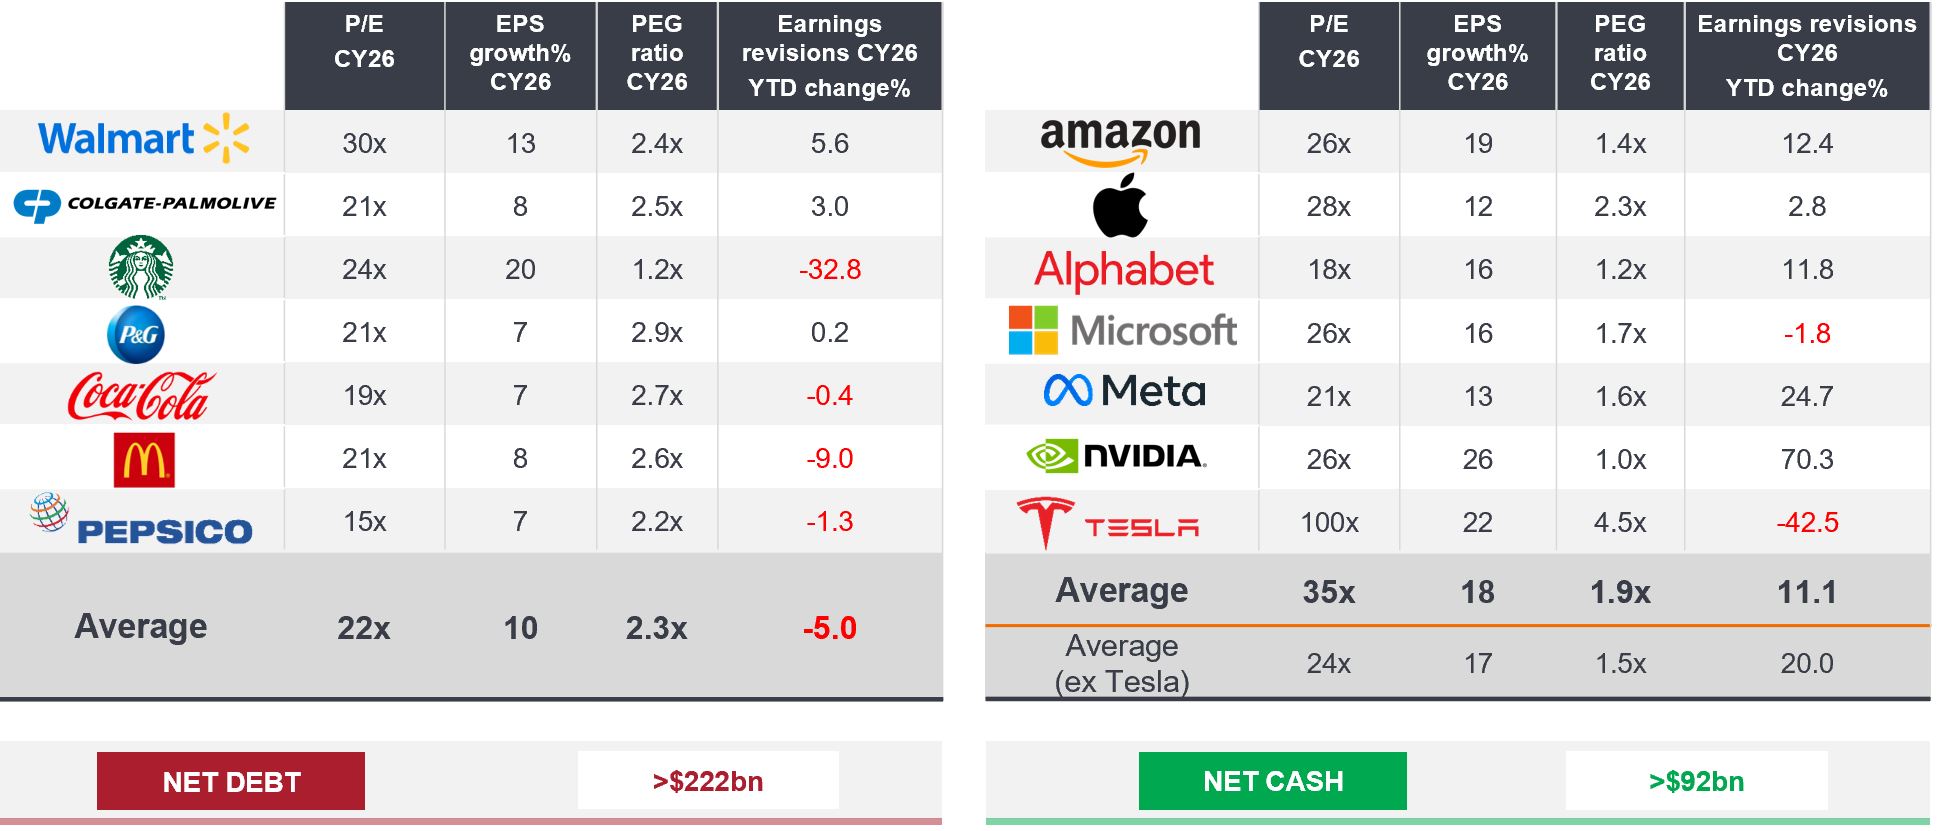
Also, branding the large caps as one homogenous group, isn’t accurate. The Mag 7 isn’t a monolith (see Figure 4). On a valuation basis, Walmart trades on four multiple points (P/E ratio) more expensive on 2026 earnings than Amazon, but it has slower growth and much lower margins.
Comparing Colgate vs Apple, McDonald’s vs NVIDIA, these companies trade at a similar level, but the contrast in earnings growth (EPS) is stark, with almost double the growth from the consumer tech companies. They also have a lower PEG (price/earnings to growth) ratio, which shows higher underappreciated earnings, which we believe is the best guide to future performance. We believe active management can add value by identifying smaller companies, but also add value in larger companies.
Figure 4: Magnificent 7 is not a monolith
Growth, valuation, momentum, capital intensity and allocation vary significantly
Source: Janus Henderson Investors, Bloomberg, as at 13 January 2025.
Note: Based on forecasts, not real data (excluding Total return performance (USD), Net debt and Net cash). P/E and Growth calculated using Earnings Per Share Adjusted. For illustrative purposes and not indicative an of any actual investment. References made to individual securities do not constitute a recommendation to buy, sell or hold any security, investment strategy or market sector, and should not be assumed to be profitable. Janus Henderson Investors, its affiliated advisor, or its employees, may have a position in the securities mentioned. There is no guarantee that past trends will continue, or forecasts will be realised. The views are subject to change without notice. Use of third-party names, marks or logos is purely for illustrative purposes and does not imply any association between any third party and Janus Henderson Investors, nor any endorsement or recommendation by or of any third party. Unless stated otherwise, trademarks are the exclusive property of their respective owners.
A strong case for active management
Ultimately, the best way to gain exposure to tech stocks is dependent on investment goals, risk tolerance, and time and effort to manage the investments. We would argue that compared to individual stock picking, investing in a fund with an active manager may be a more prudent approach. With the return of the cost of capital, selecting the winners in a ‘winner takes most’ industry such as technology is key. As a team, we believe that providing exposure to multiple themes across the underlying AI compute wave, and identifying areas of unexpected earnings growth, is most likely to drive stock market returns over the coming years.
1 MSCI.com; MSCI World Information Technology Index in USD vs MSCI World, 10-year returns to 10 March 2025.
Balance sheet strength: refers to a company being in a strong financial position. The balance sheet is a financial statement that summarises a company’s assets, liabilities and shareholders’ equity at a particular point in time.
Competitive moat: refers to factors or characteristics that give a company a durable competitive advantage.
Concentration risk: investing in a small number of stocks carries greater risk than investing in a broader range of stocks as an adverse event could result in significant volatility or losses, but the potential to outperform is also greater.
Downside: the negative movement of an economy, or the price of a security, sector, or market.
Max drawdown: the difference between the highest and lowest price of a portfolio or security during a specific period. It can help evaluate an investment’s possible reward to its risk.
EPS: earnings per share is the bottom-line measure of a company’s profitability, defined as net income (profit after tax) divided by the number of outstanding shares.
Full stack solution: refers to a comprehensive approach to software development that covers all layers of an application or project. This includes both the front-end and back-end components, as well as any other layers necessary for the application to function fully.
Fundamentals: information that contributes to the valuation of a security, such as a company’s earnings or the evaluation of its management team, as well as wider economic factors.
GPU: a graphics processing unit performs complex mathematical and geometric calculations that are necessary for graphics rendering and are also used in gaming, content creation and machine learning.
Hype cycle: a visual representation of the maturity, market perception and adoption of new technologies. Typically, markets overestimate the short-term potential of a new technology or innovation and underestimate its long-term potential, creating volatile movements both up and down for underlying stocks exposed to these technologies.
Large language model: LLM is a specialised type of artificial intelligence that has been trained on vast amounts of text to understand existing content and generate original content.
P/E ratio: price-to-earnings ratio measures share price compared to earnings per share for a stock or stocks in a portfolio.
Price/Earnings-to-Growth (PEG): the PEG ratio adds expected earnings growth to the P/E ratio. Considered a better reflection of a stock’s valuation, a lower PEG indicates that a stock is undervalued.
Volatility: the rate and extent at which the price of a portfolio, security or index, moves up and down. If the price swings up and down with large movements, it has high volatility. If the price moves more slowly and to a lesser extent, it has lower volatility. The higher the volatility the higher the risk of the investment.
These are the views of the author at the time of publication and may differ from the views of other individuals/teams at Janus Henderson Investors. References made to individual securities do not constitute a recommendation to buy, sell or hold any security, investment strategy or market sector, and should not be assumed to be profitable. Janus Henderson Investors, its affiliated advisor, or its employees, may have a position in the securities mentioned.
Past performance does not predict future returns. The value of an investment and the income from it can fall as well as rise and you may not get back the amount originally invested.
The information in this article does not qualify as an investment recommendation.
There is no guarantee that past trends will continue, or forecasts will be realised.
Marketing Communication.
Important information
Please read the following important information regarding funds related to this article.
- Shares/Units can lose value rapidly, and typically involve higher risks than bonds or money market instruments. The value of your investment may fall as a result.
- Shares of small and mid-size companies can be more volatile than shares of larger companies, and at times it may be difficult to value or to sell shares at desired times and prices, increasing the risk of losses.
- If a Fund has a high exposure to a particular country or geographical region it carries a higher level of risk than a Fund which is more broadly diversified.
- The Fund is focused towards particular industries or investment themes and may be heavily impacted by factors such as changes in government regulation, increased price competition, technological advancements and other adverse events.
- The Fund follows a sustainable investment approach, which may cause it to be overweight and/or underweight in certain sectors and thus perform differently than funds that have a similar objective but which do not integrate sustainable investment criteria when selecting securities.
- The Fund may use derivatives with the aim of reducing risk or managing the portfolio more efficiently. However this introduces other risks, in particular, that a derivative counterparty may not meet its contractual obligations.
- If the Fund holds assets in currencies other than the base currency of the Fund, or you invest in a share/unit class of a different currency to the Fund (unless hedged, i.e. mitigated by taking an offsetting position in a related security), the value of your investment may be impacted by changes in exchange rates.
- Securities within the Fund could become hard to value or to sell at a desired time and price, especially in extreme market conditions when asset prices may be falling, increasing the risk of investment losses.
- The Fund could lose money if a counterparty with which the Fund trades becomes unwilling or unable to meet its obligations, or as a result of failure or delay in operational processes or the failure of a third party provider.
Specific risks
- Shares/Units can lose value rapidly, and typically involve higher risks than bonds or money market instruments. The value of your investment may fall as a result.
- If a Fund has a high exposure to a particular country or geographical region it carries a higher level of risk than a Fund which is more broadly diversified.
- The Fund is focused towards particular industries or investment themes and may be heavily impacted by factors such as changes in government regulation, increased price competition, technological advancements and other adverse events.
- This Fund may have a particularly concentrated portfolio relative to its investment universe or other funds in its sector. An adverse event impacting even a small number of holdings could create significant volatility or losses for the Fund.
- The Fund may use derivatives with the aim of reducing risk or managing the portfolio more efficiently. However this introduces other risks, in particular, that a derivative counterparty may not meet its contractual obligations.
- If the Fund holds assets in currencies other than the base currency of the Fund, or you invest in a share/unit class of a different currency to the Fund (unless hedged, i.e. mitigated by taking an offsetting position in a related security), the value of your investment may be impacted by changes in exchange rates.
- When the Fund, or a share/unit class, seeks to mitigate exchange rate movements of a currency relative to the base currency (hedge), the hedging strategy itself may positively or negatively impact the value of the Fund due to differences in short-term interest rates between the currencies.
- Securities within the Fund could become hard to value or to sell at a desired time and price, especially in extreme market conditions when asset prices may be falling, increasing the risk of investment losses.
- The Fund could lose money if a counterparty with which the Fund trades becomes unwilling or unable to meet its obligations, or as a result of failure or delay in operational processes or the failure of a third party provider.
Specific risks
- Shares/Units can lose value rapidly, and typically involve higher risks than bonds or money market instruments. The value of your investment may fall as a result.
- If a Fund has a high exposure to a particular country or geographical region it carries a higher level of risk than a Fund which is more broadly diversified.
- The Fund is focused towards particular industries or investment themes and may be heavily impacted by factors such as changes in government regulation, increased price competition, technological advancements and other adverse events.
- This Fund may have a particularly concentrated portfolio relative to its investment universe or other funds in its sector. An adverse event impacting even a small number of holdings could create significant volatility or losses for the Fund.
- The Fund may use derivatives with the aim of reducing risk or managing the portfolio more efficiently. However this introduces other risks, in particular, that a derivative counterparty may not meet its contractual obligations.
- If the Fund holds assets in currencies other than the base currency of the Fund, or you invest in a share/unit class of a different currency to the Fund (unless hedged, i.e. mitigated by taking an offsetting position in a related security), the value of your investment may be impacted by changes in exchange rates.
- Securities within the Fund could become hard to value or to sell at a desired time and price, especially in extreme market conditions when asset prices may be falling, increasing the risk of investment losses.
- The Fund could lose money if a counterparty with which the Fund trades becomes unwilling or unable to meet its obligations, or as a result of failure or delay in operational processes or the failure of a third party provider.