Tailwinds for Emerging Markets debt
Emerging Markets Debt Hard Currency (EMDHC) Portfolio Managers Jacob Nielsen and Thomas Haugaard, and Client Portfolio Manager Matt Argent, believe the asset class will continue to deliver attractive total returns in 2024.

8 minute read
Key takeaways:
- Spreads in the Emerging Markets Debt Hard Currency (EMDHC) universe have tightened below historical averages in aggregate, but valuations remain attractive when viewed relative to several credit markets in the developed world.
- We see multiple tailwinds for the EMDHC asset class. These include attractive yield/carry opportunities, stronger economic growth dynamics relative to the developed world, improving fundamentals and the likelihood that interest rates in developed markets have peaked.
- We currently see more value in the high yield part of our universe overall (notably BB/B-rated issues) relative to investment grade issues. Further upside is, however, likely to be very country specific. Meanwhile, the elevated level of dispersion within the asset class – as measured by standard deviation of credit spreads – presents potential opportunities for patient, active investors.
Following double-digit gains in US dollar terms in 2023, the Emerging Markets Debt Hard Currency (EMDHC) asset class has continued to make progress in 2024. Year-to-date, further spread tightening – particularly in Africa and the CCC-rated segment – has outweighed the negative impact of the upward shift in the underlying US Treasury yield that coincided with significantly scaled-back expectations about the extent and magnitude of US Federal Reserve (Fed) interest rate cuts in 2024.1
Risk assets have enjoyed a supportive underpinning from data showing economic resilience in the US and optimism that the “soft landing” narrative is holding. Within the EMDHC space, “risk-on” appetite has coincided with the reopening in primary market access to a number of high yield frontier markets like Ivory Coast, Benin and Kenya. We have also seen very strong demand for debt issuance by investment grade (IG) countries like Saudia Arabia, Mexico, Hungary, Slovenia, Indonesia and Poland.2
As discussed further on in this article, we continue to see several tailwinds for the EMDHC asset class. Overall, we are more optimistic about the outlook for EMDHC relative to developed market (DM) credit, although EM country differentiation (return dispersion), in our view, will remain a key theme for active investors in this market.
Valuations
EMDHC sovereign credit spreads are currently tight, sitting at the low end of historic ranges, particularly once adjusted for the distressed (CCC and lower) segment.3 This means that in terms of aggregate credit beta risk exposure (duration-times-spread), we don’t think it makes sense for investors to be positioned aggressively relative to the benchmark JP Morgan EMBI Global Diversified Index at this juncture.
That said, current EMDHC spreads should be viewed in the context of developed market credit spreads, where valuations are also tight – if not tighter. EMDHC valuations still look attractive relative to comparable US corporate debt, for example.
EMDHC spreads, in our view, are unlikely to widen materially in the near term.4 Reasons are as follows:
- Our forward-looking credit rating model indicates that overall credit quality for countries in our universe – following severe hits to their public finances during the COVID years – is likely to improve in 2024 and 2025;
- Attractive (high single-digit) yields in our investment universe offer a buffer against potential spread widening, as well as providing a potential boost to total return prospects (See Figure 1); and
- As markets becomes more focused on growth and somewhat less on inflation, we expect a re-emergence in the negative correlation between EMDHC spreads and US Treasury yields, which could provide some protection if US economic growth disappoints, as wider spreads would be mitigated by lower underlying US Treasury yields.
We continue to see relative value opportunities in our universe, notably among BB/B names in the high yield segment. Recently, there has been some compression in single-B spreads, so, looking ahead, we expect further excess return upside from here on to be more country specific.
In essence, we think investors can continue to achieve attractive total returns from this asset class even considering where spreads are currently. Figure 1 shows our estimated total returns for 2024 based on potential rates/spread moves. It shows that, for the asset class to deliver a negative total return in 2024, we would need to see a substantial rise in both EMDHC spreads and the US 10-year Treasury yield.
Figure 1: All-in yield offers a significant buffer going forward
Estimated total returns based on potential rates/spread moves
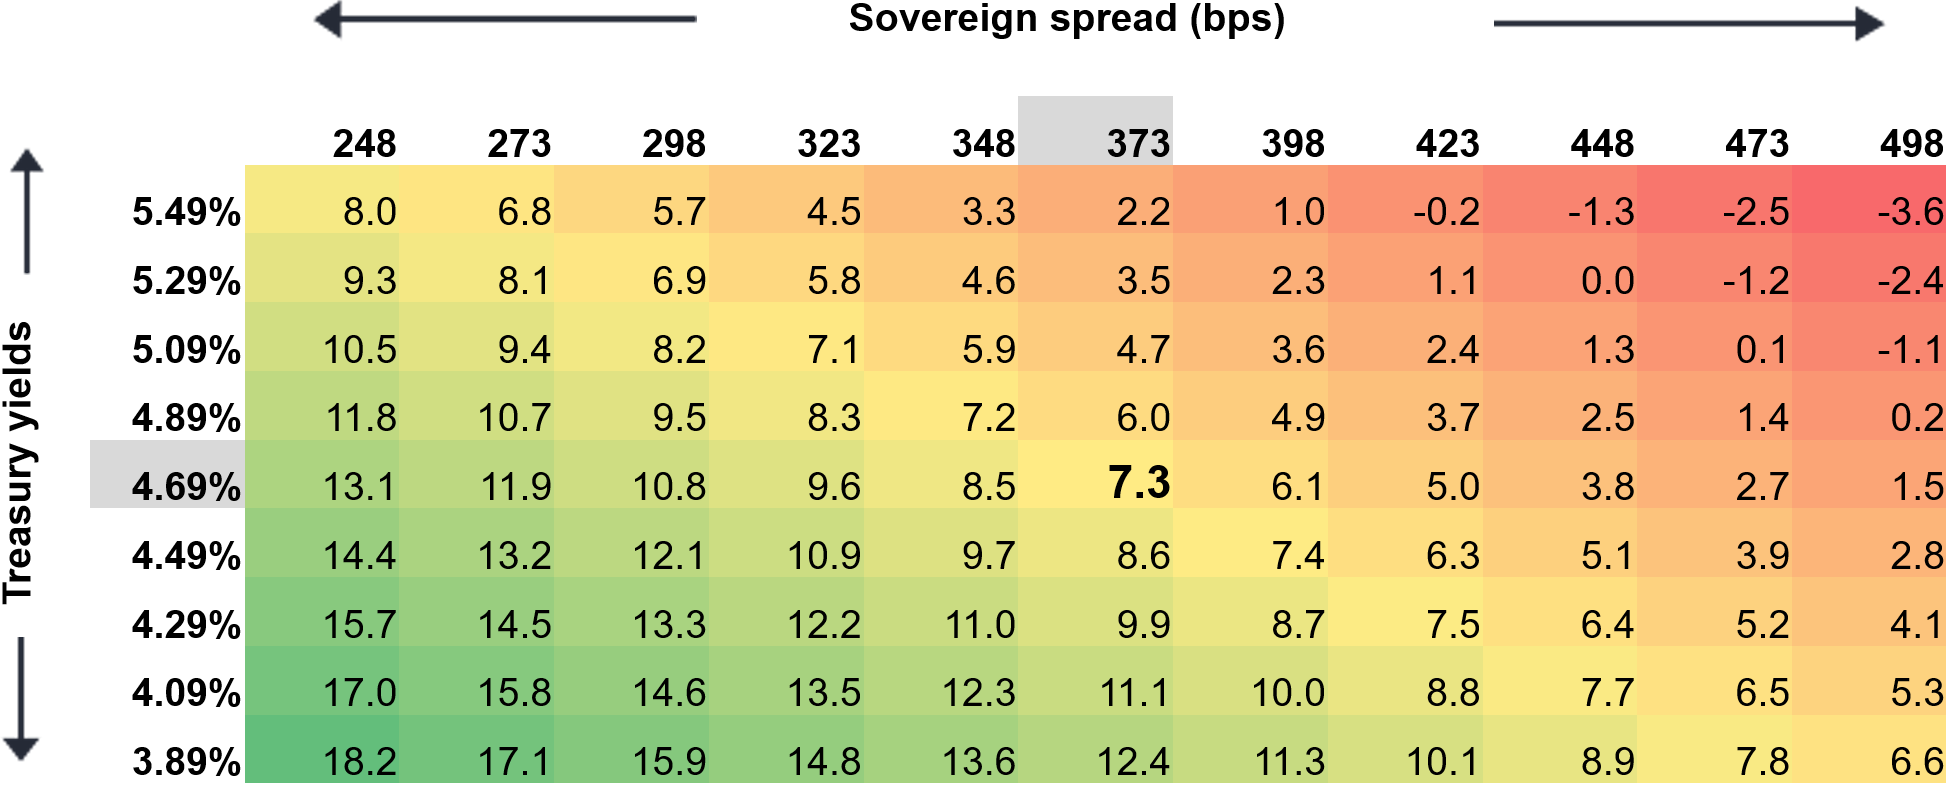
Source: Janus Henderson Investors, as of 29 April 2024. Treasury yields are US 10-year yields. For illustrative purposes. Estimated returns based on annual carry calculation, adjusted for rates and spread changes. Yields may vary and are subject to change. Past performance does not predict future returns.
Supportive tailwinds
The global market environment looks to be mostly supportive for the asset class. The following factors, in aggregate, represent tailwinds for EMDHC in our view:
- While we have seen rate volatility recently and indications that the downtrend in US inflation has been stalling (much less so elsewhere), the consensus view continues to hold that the Fed is now most likely at terminal rates, with the bar for rate hikes being high.5 This means that US Treasury yields are unlikely to be a significant headwind for EMDHC. Further, if history is a guide, EMDHC returns in the two years following the end of an interest rate tightening cycle have been above average.
- The chances of a soft-landing in the US have increased, and central banks have ample ammunition to ease policy/cut rates if required. Further, unless we continue to see positive growth surprises in the US relative to the rest of the world, we may see a weaker bias to the US dollar, which translates positively in terms of debt sustainability for sovereign issuers of US-dollar debt.
- Leading indicators in emerging markets have recently improved, suggesting that a recovery is taking shape.
- Emerging markets are ahead of the US in the cycle. Many EM countries have ample scope for monetary policy easing due to their higher starting point for real rates and improving inflation dynamics. So far in 2024, we have seen further central bank easing in the EM space.
- China’s economic growth has been slowing, but we expect a “muddle through” scenario, not a crisis. The announcement of the “around 5%” growth target looks ambitious (versus consensus forecasts of around 4.5% for 2024) and may hint at further targeted stimulus. The property market slump has hurt confidence and the unwillingness of households to spend savings remain headwinds in China. Nevertheless, there are early signs of stabilisation as recent Purchasing Managers Index (PMI) readings have come in stronger than market consensus and investment banks are revising 2024 growth projections upwards.6 The negative spill-over effects from slowing growth in China on EM will be likely more muted than in the past but could weigh more heavily on specific commodity exporters.
- Economic growth in emerging markets (EM) is continuing to outpace growth in developed economies, including the US. Our base case is that the emerging market/developed market economic growth differential is shifting higher over the forecast horizon, although so far in 2024, better US growth has delayed a widening in this differential. Figure 2 shows growth forecasts for EM countries versus the US, based on the International Monetary Fund’s (IMF) most recent outlook.
Figure 2: Resilience in US delays widening in EM-US growth differential
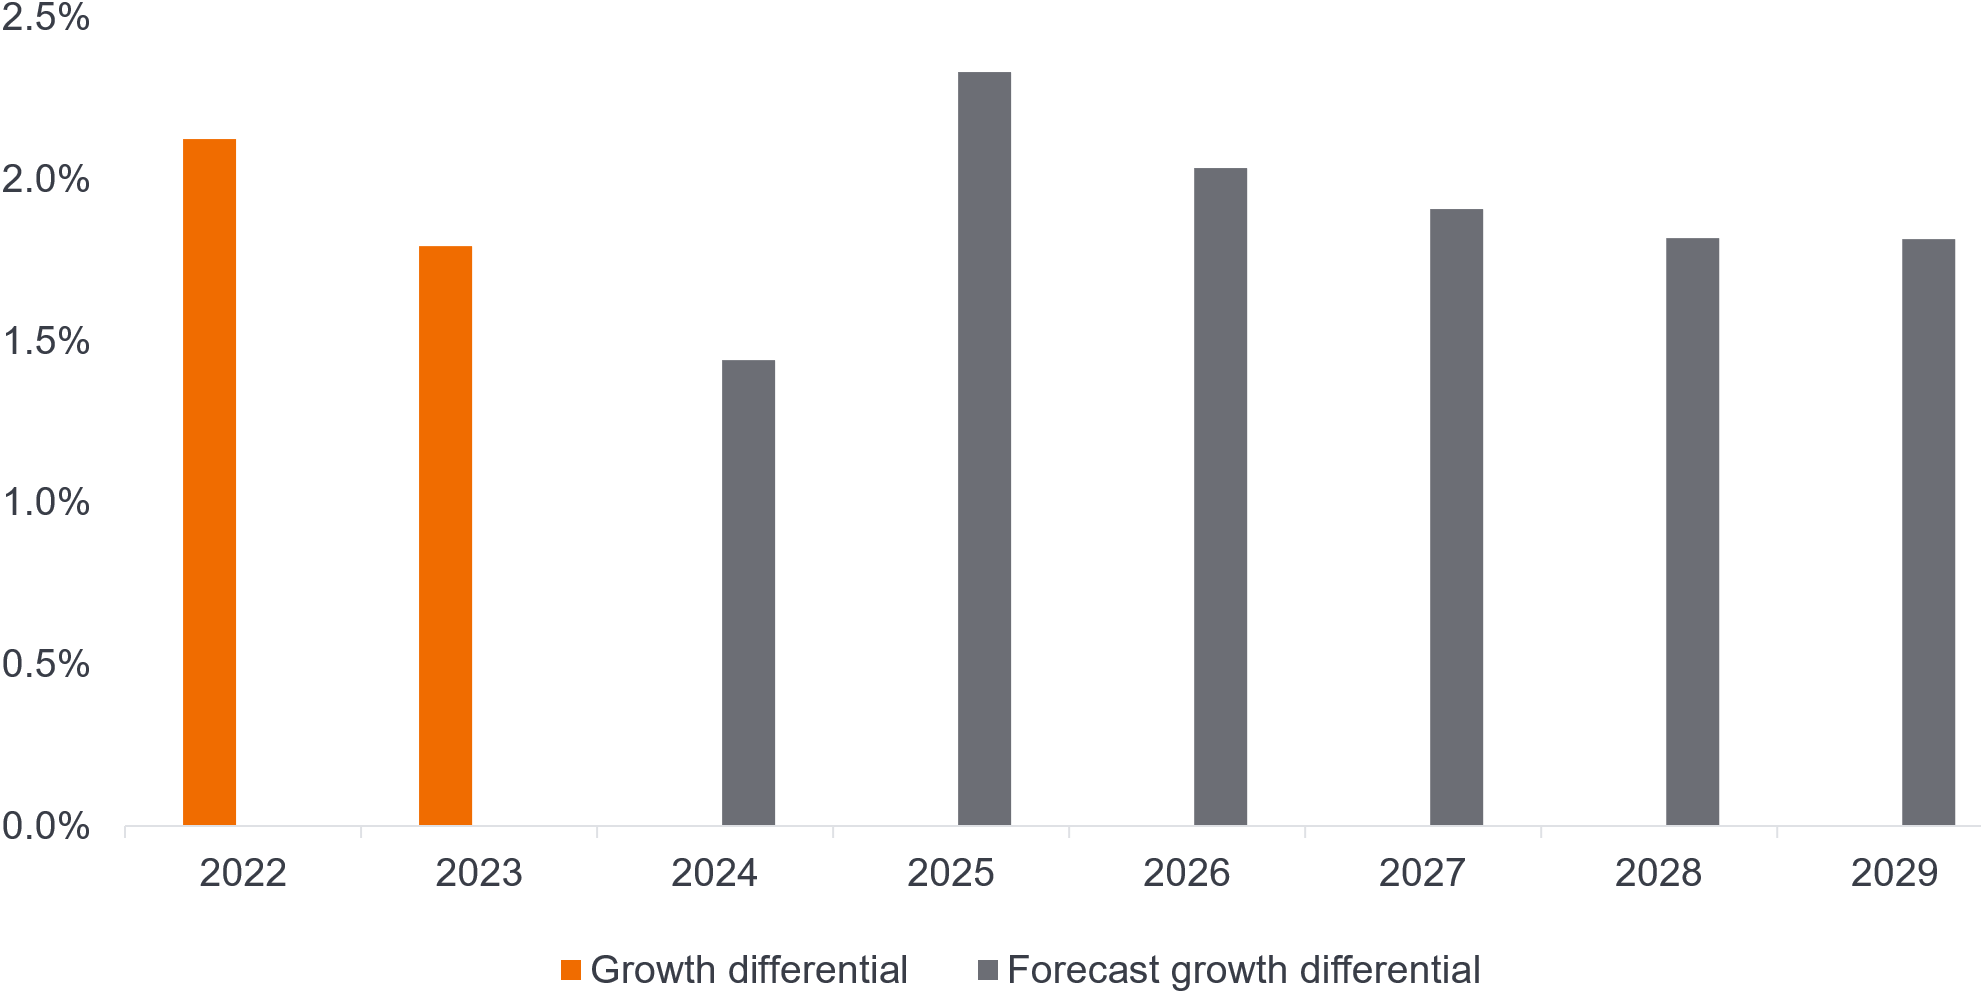
Source: IMF World Economic Outlook database, April 2024 (latest available data) and Janus Henderson. Chart shows excess economic growth – current and forecast – for emerging and developing economies relative to that of the United States. Growth rate differential calculations are based on GDP, constant prices, percent change data. Over the forecast period (2024-2029), IMF figures expects growth in emerging and developing economies to exceed that of the US by 1.9% on average. There is no guarantee that past trends will continue, or forecasts will be realised.
Fundamentals set to improve
Based on our forward-looking credit ratings model, we expect overall credit quality for the Emerging Market Bond Index (EMBI) universe to improve in 2024 and 2025. Drivers for this are mainly economic recovery and some fiscal consolidation.7 A notable positive so far this year has been the ability of some high yield countries – including those in sub-Saharan Africa – to issue new debt.
Meanwhile, progress is being made in restructuring cases and we see no further sovereign defaults in 2024. The most vulnerable countries in our universe are currently in funded IMF programmes and accessing other sources of financing. In our view, the risk of broader contagion from the group of distressed countries to the overall emerging markets asset class is limited.
Market technicals – a bright spot for 2024?
Prior outflows in 2022 and 2023 have left a cleaner starting point for the asset class in terms of market technicals. In our view, demand/supply dynamics could potentially turn more supportive for the asset class later in 2024.
Higher all-in yields in fixed income could support demand from EM investors and bring sequential improvement in flows, although this is largely contingent on Fed rate cuts coming through. In particular, if the US dollar cycle turns down, we might expect to see increasing allocations into EM assets given the negative correlation between the US dollar and EM capital flows.
Elevated dispersion creates opportunities
In previous client communications, we have highlighted the high level of dispersion – as measured by standard deviation of credit spreads – within our investment universe. This continues to be the case and we expect dispersion – and the gap between winners and losers – to remain elevated as we move through the cycle. For active investors, this equates to an opportunity to add value relative to the JP Morgan EMBI Global Diversified Index (EMBIGD). With careful issuer/issue selection – and without the need to take outsized “bets” – we believe it is possible to continue to deliver incremental positive excess returns while also harvesting the attractive carry currently on offer within our universe.
1 Illustrative of the significant backup of 10-year US Treasury yields, the US Treasury yield at the start of 2024 was 3.898% and, at the time of writing (9 May 2024), had risen to 4.518%, having briefly hit a year-to-date high of 4.704% on 25 April 2024. Source: Investing.com.
2 For more information on EM debt issuance in the first quarter of 2024, see the English-language article titled Market access improving for EM debt issuers, accessible via a number of Janus Henderson professional investor websites.
3 As of 14 May 2024, the spread on the JP Morgan EMBI Global Diversified Index was 370 basis points. Source: JP Morgan.
4 One risk to this view, which we continue to monitor, is geopolitical risk. Geopolitical risks remain elevated, which could put pressure on EM spreads at the asset class level.
5 US CPI-U data for April 2024 showed a 3.4% year-on-year gain (softening from the 3.5% increase for the 12 months ending March 2024), while core CPI, which excludes volatile food and energy prices, gained 3.6% for the 12 months ending April 2024. On a month-on-month basis, April’s CPI-U reading was +0.3% on a seasonally adjusted basis (after advancing 0.4% m-o-m in March). The modest decline, in line with expectations, suggests a gradual cooling in domestic demand, although the country is certainly not out of the woods as far as inflation is concerned. Source: US Bureau of Labour Statistics. According to FX street, the US dollar Index declined 0.5% to 104.50 on the news.
6 China’s PMI level was 50.4 as of 30 April 2024. This represents a slight dip from the 50.8 reading as of 31 March 2024, but is higher than the reading for the 11 months prior to 31 March 2024. Source: Y charts.
7 Readers may be interested to note that our view, based on our proprietary forward-looking model, regarding improving fundamentals is echoed by ratings agency Fitch in its 17 April commentary titled Emerging-Market Sovereign Rating Momentum Is Positive. Fitch reports the number of ratings upgrades so far in 2024 (Costa Rica, Jamaica, Qatar and Turkey) has outnumbering the downgrades (Bolivia and Panama). Further, Fitch states that the number of net positive rating outlooks is at its highest level since October 2011, largely reflecting idiosyncratic country-specific developments.
Basis point. One basis point equals 1/100 of a percentage point. 1 bp = 0.01%, 100 bps = 1%.
Credit metrics. Numerical representations of a borrower’s financial stability and creditworthiness. Examples include a credit score, a debt-to-income ratio, an interest coverage ratio and a credit utilisation ratio.
Credit risk. The risk that a borrower will default on its contractual obligations to make the required interest payments or repay the loan. Anything that improves conditions for a company can help to lower credit risk.
Dispersion. Dispersion, also called variability or scatter, is the extent to which numerical data varies, or is likely to vary, about an average value.
Diversification. A way of spreading risk by mixing different types of assets/asset classes in a portfolio, on the assumption that these assets will behave differently in any given scenario. Assets with low correlation should provide the most diversification.
Emerging market. The economy of a developing country that is transitioning to become more integrated with the global economy. This can include making progress in areas such as depth and access to bond and equity markets and development of modern financial and regulatory institutions.
Eurobond. A bond denominated in a currency not native to the country where it is issued.
Geopolitics. Politics, especially international relations, influenced by geographical factors.
High yield bond. A bond with a lower credit rating than an investment grade bond, also known as a sub-investment grade bond, or ‘junk’ bond. These bonds usually carry a higher risk of the issuer defaulting on their payments, so they are typically issued with a higher interest rate (coupon) to compensate for the additional risk.
International Monetary Fund (IMF): The IMF is a global organization that works to achieve sustainable growth and prosperity for all its 190 member countries. It does so by supporting economic policies that promote financial stability and monetary cooperation, which are essential to increase productivity, job creation and economic well-being. The IMF is governed by and accountable to its member countries.
Investment-grade. Debt issued by governments or companies perceived to have a relatively low risk of defaulting on their payments, reflected in the higher rating given to them by credit ratings agencies.
JP Morgan EMBI Global Diversified Index (EMBIGD). A widely used benchmark, or investable universe proxy, for hard currency emerging market debt. This index tracks liquid US dollar emerging market fixed and floating-rate debt instruments issued by sovereign and quasi-sovereign entities.
JP Morgan Government Bond Index-Emerging Markets (GBI-EM). A widely used benchmark, or investable universe proxy, for emerging market debt issued in local (domestic) currency.
Monetary policy: The policies of a central bank, aimed at influencing the level of inflation and growth in an economy. It includes controlling interest rates and the supply of money. Monetary stimulus refers to a central bank increasing the supply of money and lowering borrowing costs. Monetary tightening refers to central bank activity aimed at curbing inflation and slowing down growth in the economy by raising interest rates and reducing the supply of money.
MOVE Index. The MOVE index, short for “Merrill Option Volatility Estimate Index,” is a measure of expected short-term volatility in the US Treasury bond market.
Percentile. A statistical measure to express where an observation falls in a range of other observations. A 90th percentile data point, for example, is the value below which 90% of data points fall.
Purchasing Managers’ Index (PMI). An indicator of the economic health of the manufacturing sector. A reading of 50 indicates no change in the environment. A reading above 50 indicates sectoral expansion; below 50 indicates contraction.
Volatility. The rate and extent at which the price of a portfolio, security or index, moves up and down. If the price swings up and down with large movements, it has high volatility. If the price moves more slowly and to a lesser extent, it has lower volatility. The higher the volatility the higher the risk of the investment.
Important information
Past performance does not predict future returns. There is no guarantee that past trends will continue, or forecasts will be realised.
Fixed income securities are subject to interest rate, inflation, credit and default risk. The bond market is volatile. As interest rates rise, bond prices usually fall, and vice versa. The return of principal is not guaranteed, and prices may decline if an issuer fails to make timely payments or its credit strength weakens.
High-yield or “junk” bonds involve a greater risk of default and price volatility and can experience sudden and sharp price swings.
Beta measures the volatility of a security or portfolio relative to an index. Less than one means lower volatility than the index; more than one means greater volatility.
These are the views of the author at the time of publication and may differ from the views of other individuals/teams at Janus Henderson Investors. References made to individual securities do not constitute a recommendation to buy, sell or hold any security, investment strategy or market sector, and should not be assumed to be profitable. Janus Henderson Investors, its affiliated advisor, or its employees, may have a position in the securities mentioned.
Past performance does not predict future returns. The value of an investment and the income from it can fall as well as rise and you may not get back the amount originally invested.
The information in this article does not qualify as an investment recommendation.
There is no guarantee that past trends will continue, or forecasts will be realised.
Marketing Communication.
8 minute read
Key takeaways:
- Spreads in the Emerging Markets Debt Hard Currency (EMDHC) universe have tightened below historical averages in aggregate, but valuations remain attractive when viewed relative to several credit markets in the developed world.
- We see multiple tailwinds for the EMDHC asset class. These include attractive yield/carry opportunities, stronger economic growth dynamics relative to the developed world, improving fundamentals and the likelihood that interest rates in developed markets have peaked.
- We currently see more value in the high yield part of our universe overall (notably BB/B-rated issues) relative to investment grade issues. Further upside is, however, likely to be very country specific. Meanwhile, the elevated level of dispersion within the asset class – as measured by standard deviation of credit spreads – presents potential opportunities for patient, active investors.