An options-implied analysis of the US presidential election: Part II
In part two of a series on the U.S. presidential election, Head of Global Asset Allocation Ashwin Alankar and Chief Investment Strategist Myron Scholes explain how options markets are likely better indicators of an election’s potential outcome than polling data.

5 minute read
Key takeaways:
- While Vice President Harris has risen in the polls, signals derived from options markets indicate a closer race.
- We believe that options prices can contain powerful signals on an election’s potential outcome, as there is a cost to being wrong and prices tend to incorporate a broader array of information than polling data.
- With two months remaining until the election, investors may be well served to consider options market signals as an effective tool to cut through the noise as campaigning reaches its crescendo.
Not only does Labor Day mark the unofficial end of summer in the U.S., but every four years it also signals the home stretch of the country’s presidential election. We see this as an opportune time to revisit our analysis of the U.S. election through the lens of the options market. We consider information embedded in options a powerful signal on the near- to mid-term trajectory of underlying equities, and with the election fast approaching, investors are likely positioning themselves for what they consider to be the most likely outcome of the presidential contest.
Much has changed since our initial analysis in early July. Former President Donald Trump survived an assassination attempt, and after a poor debate performance, President Joe Biden ended his campaign, paving the way for Vice President Kamala Harris to receive the Democratic nomination. Both options prices and polling data have taken notice.
Diverging signals?
We base our analysis on upside and downside risk signals derived from call and put options on baskets of equities that have historically done well under either Democrat or Republican administrations. Should markets reflect the prevailing consensus conveyed in polling data, the upside-to-downside potential for each of these baskets would be roughly even.
If, however, options markets expected an outcome different than consensus, these baskets’ potential for outsized gains – or losses – would diverge. This has been the case for much of the year, with options markets implying a greater chance of Democrats maintaining the presidency than what had been reflected in the polls.
Exhibit 1: Relationship of Democrat-to Republican tail-Sharpe ratios
After a volatile two months, the upside potential for “Republican” and “Democrat” equities buckets are roughly equal.
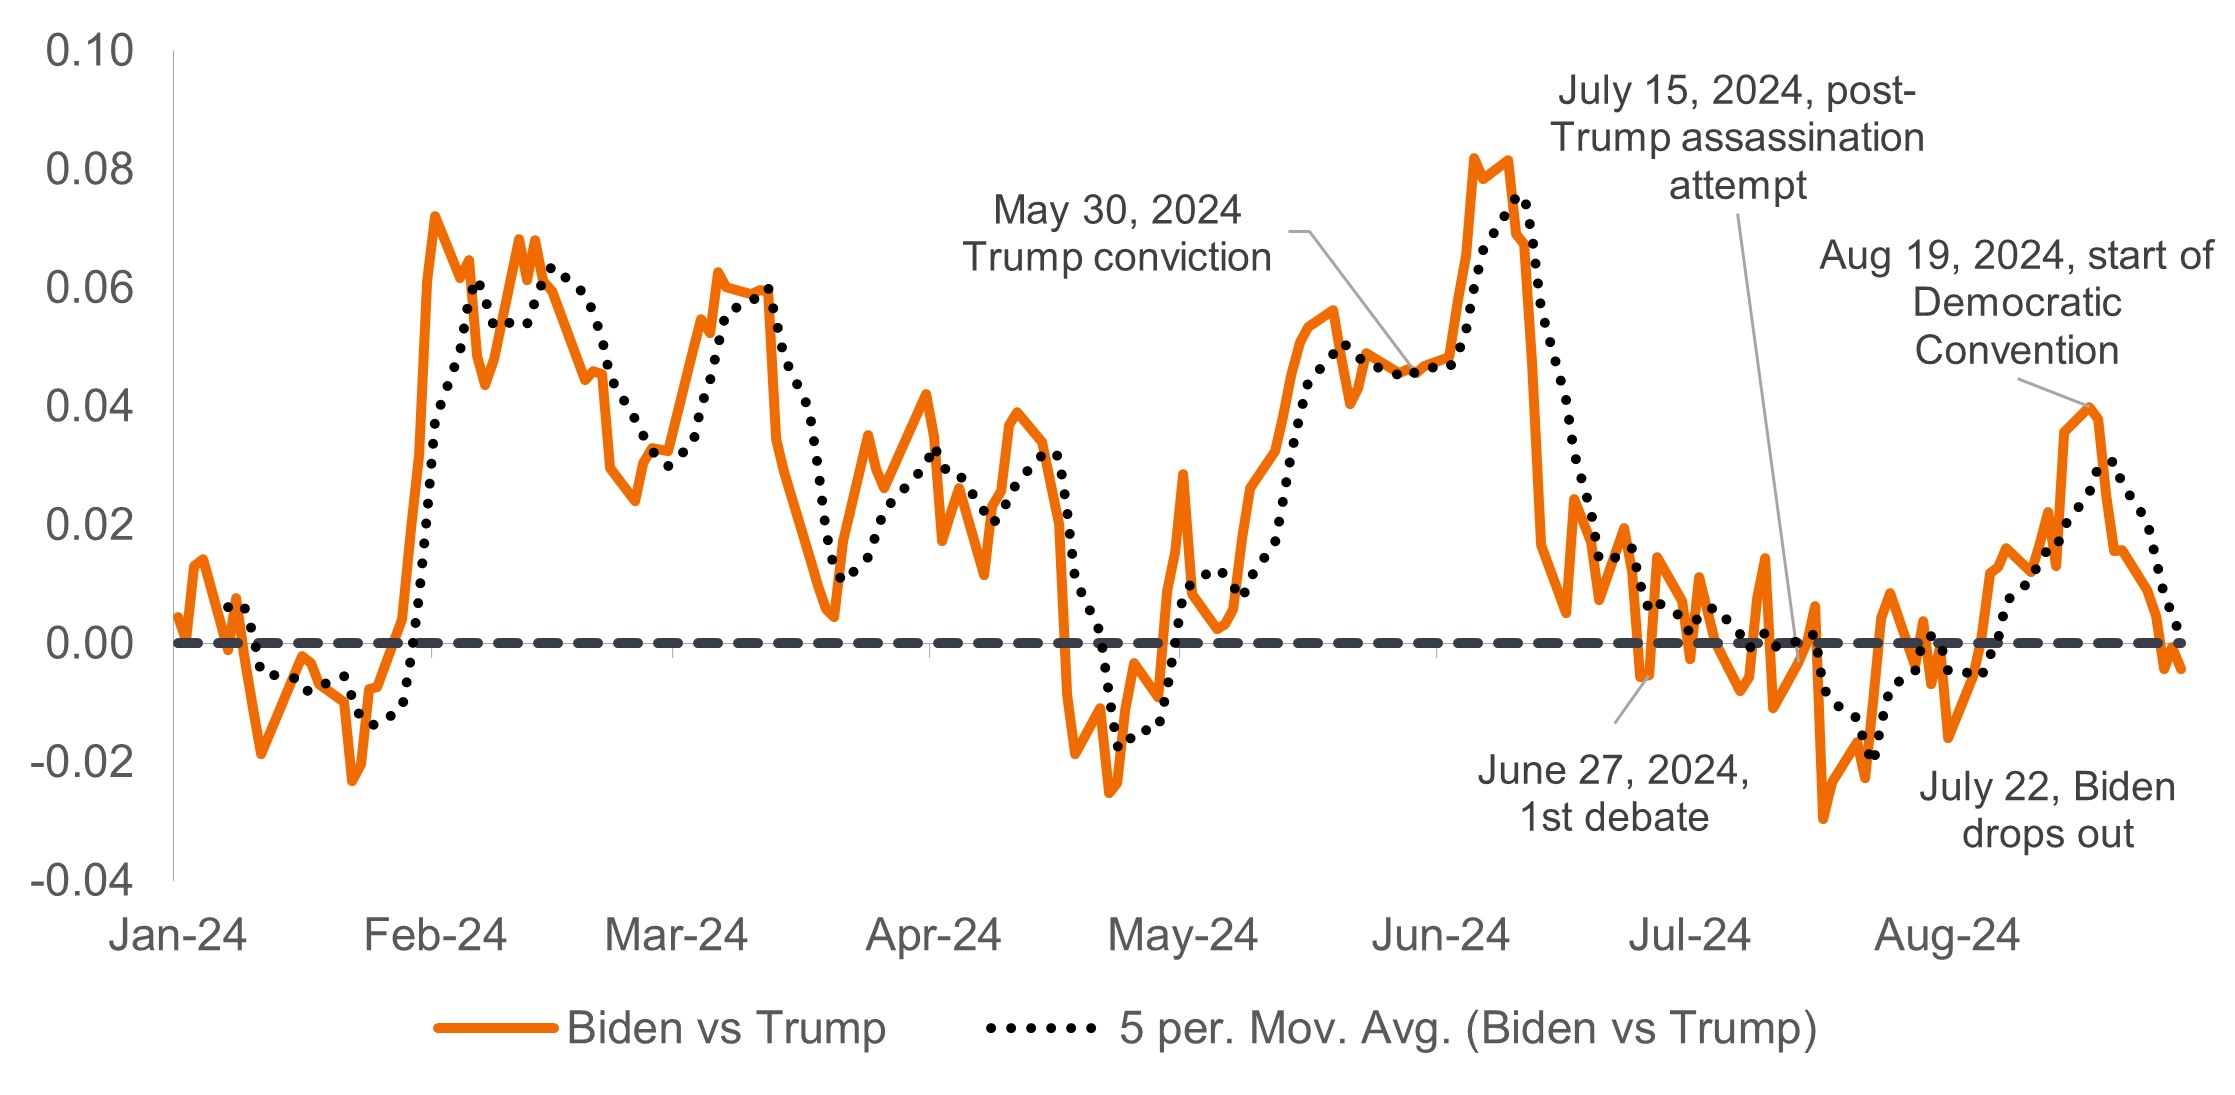 Source: Strategas, Janus Henderson Investors as of 30 August 2024. Note: Line above 0.00 represents greater upside to downside ratios for Democrat equities bucket relative to Republican.
Once the ambiguity surrounding the Democratic ticket was resolved, options again signaled the incumbent party likely retaining the White House in the leadup to the Democratic National Convention. That trend, however, has since reversed, with options now seeing a closer race than indicated by polling data, which show Harris’s lead expanding.
Hard data please
As Americans become immersed – voluntarily or not – in the final stages of the campaign, many political operatives and voters will obsess over the latest polls, seeking to divine clues on the election’s outcome. We believe a better target of their focus would be options-implied signals because they represent hard data.
Investors expose themselves to a cost when conveying their views on the fate of a particular stock or sector. Consequently, they tend to act methodically – taking into account both risks and rewards – when making investment decisions. We view polls, in contrast, as soft data because there is no cost – or penalty – should the respondent’s input turn out to be incorrect, not well thought out, or simply counter to their true views.
Exhibit 2: Aggregated presidential polling data
As is often the case, Vice President Harris has enjoyed a post-convention boost.
 Source: Real Clear Politics, as of 30 August 2024.
Furthermore, options prices represent an aggregated view of all factors that could affect a security, sector, or asset class, whereas polling surveys tend to represent an often-discrete view on a specific subject – and one than can be influenced by how the question is framed. Given this, we believe the greater breadth of information incorporated in options prices provides a more holistic view on a particular subject – in this case the election – than polling data.
A real-time case study
Evidence of options signals’ more-encompassing view can be seen in the early-year divergence between it and polling data. While Trump led in the polls, options indicated greater upside potential for stocks positioned to benefit from a Democratic policy agenda. The reason for this is while most polls narrowly focused on President Biden leading the Democratic ticket, the thousands of signals conveyed within options prices took into account all potential scenarios, including the ascension of an alternative Democratic standard bearer.
An eternity
Candidates typically receive a post-convention boost in the polls, and in Harris’s case, this was likely magnified by the enthusiasm for a younger candidate. While this momentum has been maintained in the polls, options markets now see similar upside-to-downside potential for Democrat and Republican equity baskets. This balance could indicate that the conventional wisdom expressed in polls is overstated, meaning Harris’s lead may not be as firm as it may seem.
The race continues to be fluid and the post-convention bump enjoyed by the Vice President may be fading. As illustrated by the dramatic events of the past few months, the adage a week is an eternity in politics rings true and is something to keep in mind over the next eight weeks.
IMPORTANT INFORMATION
Options (calls and puts) involve risks. Option trading can be speculative in nature and carries a substantial risk of loss.
Volatility measures risk using the dispersion of returns for a given investment.
These are the views of the author at the time of publication and may differ from the views of other individuals/teams at Janus Henderson Investors. References made to individual securities do not constitute a recommendation to buy, sell or hold any security, investment strategy or market sector, and should not be assumed to be profitable. Janus Henderson Investors, its affiliated advisor, or its employees, may have a position in the securities mentioned.
Past performance does not predict future returns. The value of an investment and the income from it can fall as well as rise and you may not get back the amount originally invested.
The information in this article does not qualify as an investment recommendation.
There is no guarantee that past trends will continue, or forecasts will be realised.
Marketing Communication.
5 minute read
Key takeaways:
- While Vice President Harris has risen in the polls, signals derived from options markets indicate a closer race.
- We believe that options prices can contain powerful signals on an election’s potential outcome, as there is a cost to being wrong and prices tend to incorporate a broader array of information than polling data.
- With two months remaining until the election, investors may be well served to consider options market signals as an effective tool to cut through the noise as campaigning reaches its crescendo.


