Until recently, European and Japanese financials were rarely thought of for their strong return potential. More often, investors heard about banking scandals and declining profitability amid negative rates and gave these firms a wide berth.
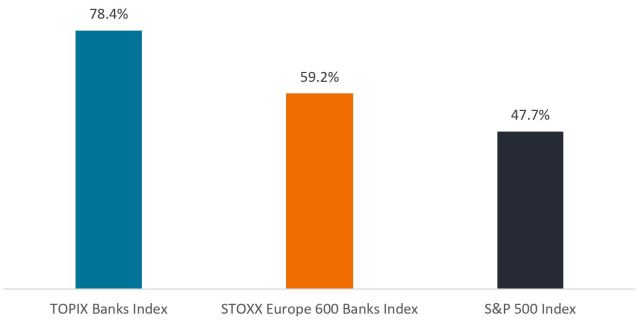
But lately, that viewpoint has been changing. Since the end of 2022, the TOPIX Banks Index, a benchmark of Japanese banks listed on the Tokyo Stock Exchange, has delivered a cumulative return of 78.4% and the STOXX Europe 600 Banks Index has gained nearly 60%. By comparison, the S&P 500® Index had a total return of just under 50% for the same period. (All returns in local currency terms.)
Exhibit 1: European and Japanese banks outperform
Total return (30 Dec 2022 to 3 September 2024)

Source: Bloomberg, data from 30 December 2022 to 3 September 2024. The TOPIX Banks Index is a capitalization-weighted index of all the banks listed on the First Section of the Tokyo Stock Exchange. The STOXX 600 Banks Index is a capitalization-weighted index which includes European companies that are involved in the bank sector.
As impressive as these rallies are, they may not be done. In our view, elevated interest rates, corporate reforms, and other factors such as industry consolidation could provide European and Japanese financials with more upside.
Normalized rates boost profits
Prior to 2022, both Europe and Japan had in place zero or negative interest rate schemes meant to revive the regions’ respective economies. In Europe, negative rates lasted for roughly a decade; in Japan, they endured for eight years. In that time, bank net interest income took a hit as the spread between interest paid on deposits and that earned on loans narrowed and as institutions were sometimes charged to keep excess reserves at central banks, rather than be paid interest.
But when inflation ignited after the Covid-19 pandemic, monetary policy reversed course and interest rates rose to levels not seen in decades. The Bank of Japan was the last central bank to move, but has hiked rates twice so far in 2024, the first time policymakers have increased rates in 17 years.
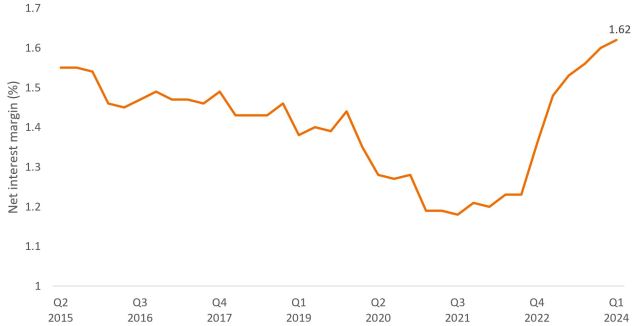
Subsequently, net interest margins have climbed, hitting 1.62% on average in Europe during the first quarter of 2024, up from a low of 1.18% in 2021 (Exhibit 2). A similar trend is expected to follow in Japan. In late 2023, major Japanese banks were projecting that an increase of 10 basis points in short-term rates would boost annual net interest income by as much as ¥35 billion ($240 million).[i]
Exhibit 2: Net interest income on the rise

Source: European Central Bank, from 30 June 2015 to 30 March 2024.
Corporate reforms and market structure drive shareholder value
While some central banks are now beginning to loosen monetary policy, rates are unlikely to return to the zero-bound, given current inflation levels and still-resilient economic growth. And the absence of recession has helped keep a lid on non-performing loan growth.
New corporate and market structures are also delivering long-term benefits. In Europe, banks have spent more than a decade improving the size and quality of capital reserves as part of regulatory changes following the Global Financial Crisis, with final rules still being rolled out. At the same time, risk controls and cost-cutting measures honed during the days of negative rates have vastly improved many firms’ operating efficiency.
Industry consolidation has been another tailwind. In Denmark, for example, four banks now hold more than 80% of savings deposits in the country.[ii] More broadly, money market funds command less market share in Europe than in the U.S., limiting the pressure to raise yields on savings accounts to attract deposits. In March 2023, for example, amid a string of bank failures in the U.S., European money market funds saw inflows of $19.3 billion. In the U.S., inflows for that month totaled $367 billion.[iii]
In Japan, a 2023 mandate by the Tokyo Stock Exchange for publicly listed companies to improve their corporate value — or risk being delisted — has sharpened banks’ focus on shareholder return. That has included the unwinding of cross shareholdings in other companies, freeing up capital that can be returned to investors in the form of dividends and share buybacks. As such, from 2022 to 2026, the three largest Japanese financials are projected to raise their annual dividend per share by a total of 60% or more.[iv]
Being mindful of anchoring biases
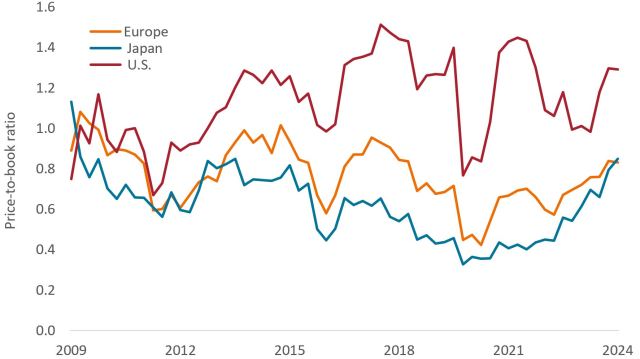
Despite these positive trends, European and Japanese bank stocks still trade at a price-to-book (P/B) ratio of less than 1 and well below that of U.S. peers (Exhibit 3). (P/B ratios reflect the market’s valuation of a company relative to the firm’s net assets.)
Exhibit 3: European and Japanese banks trade at a discount

Source: Bloomberg, data are quarterly from 30 June 2009 to 28 June 2024. Europe = STOXX Europe 600 Banks Index. Japan = TOPIX Banks Index. U.S. = Russell 1000 Index Banks Subsector, a benchmark of bank stocks in the Russell 1000 Index.
While some discounting may be warranted, we believe the valuation gap also reflects anchoring bias — a tendency among investors to reference European and Japanese banks’ past underperformance when making investment decisions.
But at a time when some high-growth areas of the market have experienced rapid multiple expansion and have come to dominate equity indices, investors might do well to focus on today’s market fundamentals. An active strategy could help investors pinpoint these opportunities — especially among what might be unfamiliar companies — and provide much-needed diversification benefits.
[i] S&P Global, “End to negative interest rates in Japan to boost lenders’ margins,” 21 March 2024.
[ii] Janus Henderson Investors, as of 19 July 2024.
[iii] Deloitte, “2024 banking and capital markets outlook,” 5 October 2023.
[iv] S&P Global, “Japan’s megabanks to reward shareholders with higher dividends as profits rise,” 29 July 2024.
IMPORTANT INFORMATION
Actively managed portfolios may fail to produce the intended results. No investment strategy can ensure a profit or eliminate the risk of loss.
Diversification neither assures a profit nor eliminates the risk of experiencing investment losses.
Foreign securities are subject to additional risks including currency fluctuations, political and economic uncertainty, increased volatility, lower liquidity and differing financial and information reporting standards, all of which are magnified in emerging markets.
Basis point (bp) equals 1/100 of a percentage point. 1 bp = 0.01%, 100 bps = 1%.
Monetary Policy refers to the policies of a central bank, aimed at influencing the level of inflation and growth in an economy. It includes controlling interest rates and the supply of money.
Price-to-book (P/B) ratio is a financial ratio used to value a company’s shares. It is calculated by dividing a company’s market value (share price) by the book value of its equity (value of the company’s assets on its balance sheet). A P/B value <1 can indicate a potentially undervalued company or a declining business. The higher the P/B ratio, the higher the premium the market is willing to pay for the company above the book (balance sheet) value of its assets.
Russell 1000® Index reflects the performance of U.S. large-cap equities.
S&P 500® Index reflects U.S. large-cap equity performance and represents broad U.S. equity market performance.
STOXX® Europe 600 Index represents large, mid and small capitalization companies across 17 countries in the European region.
A yield curve plots the yields (interest rate) of bonds with equal credit quality but differing maturity dates. Typically bonds with longer maturities have higher yields.
JHI
JHI
These are the views of the author at the time of publication and may differ from the views of other individuals/teams at Janus Henderson Investors. References made to individual securities do not constitute a recommendation to buy, sell or hold any security, investment strategy or market sector, and should not be assumed to be profitable. Janus Henderson Investors, its affiliated advisor, or its employees, may have a position in the securities mentioned.
Past performance does not predict future returns. The value of an investment and the income from it can fall as well as rise and you may not get back the amount originally invested.
The information in this article does not qualify as an investment recommendation.
There is no guarantee that past trends will continue, or forecasts will be realised.
Marketing Communication.
Important information
Please read the following important information regarding funds related to this article.
- Shares/Units can lose value rapidly, and typically involve higher risks than bonds or money market instruments. The value of your investment may fall as a result.
- Emerging markets expose the Fund to higher volatility and greater risk of loss than developed markets; they are susceptible to adverse political and economic events, and may be less well regulated with less robust custody and settlement procedures.
- The Fund may use derivatives with the aim of reducing risk or managing the portfolio more efficiently. However this introduces other risks, in particular, that a derivative counterparty may not meet its contractual obligations.
- If the Fund holds assets in currencies other than the base currency of the Fund, or you invest in a share/unit class of a different currency to the Fund (unless hedged, i.e. mitigated by taking an offsetting position in a related security), the value of your investment may be impacted by changes in exchange rates.
- When the Fund, or a share/unit class, seeks to mitigate exchange rate movements of a currency relative to the base currency (hedge), the hedging strategy itself may positively or negatively impact the value of the Fund due to differences in short-term interest rates between the currencies.
- Securities within the Fund could become hard to value or to sell at a desired time and price, especially in extreme market conditions when asset prices may be falling, increasing the risk of investment losses.
- The Fund could lose money if a counterparty with which the Fund trades becomes unwilling or unable to meet its obligations, or as a result of failure or delay in operational processes or the failure of a third party provider.