Equity outlook: A broadening of opportunities
In their mid-year outlook for global stocks, Head of Americas Equities Marc Pinto and Head of EMEA and Asia Pacific Equities Lucas Klein argue that while risks of an economic slowdown remain, the potential for unlocking new shareholder value is also strong.


10 minute read
Key takeaways:
- U.S. mega-cap tech firms continued to lead global equity markets in the first half of 2024, but other areas of the market showed signs of benefiting from innovation, policy reform, and comparatively attractive valuations.
- In our view, the trend points to a broadening of equity opportunities for the remainder of 2024.
- We believe investors should look for a combination of fundamentals and valuation, especially amid elevated interest rates and other risks to economic growth.
At the end of last year, markets were forecasting several interest rate cuts by mid-2024 in anticipation of cooling inflation and a slower job market. We were more skeptical. We also said a “hard landing,” or recession, was not the base-case scenario for the economy, and that a resilient U.S. consumer and earnings growth could help support equities.
As it turns out, markets not only met our expectations but exceeded them – so much so that many now wonder where stocks can go from here. We agree some trends fall well outside their typical range. We also recognize that elevated interest rates and an inverted Treasury yield curve – a historically reliable indicator of recession in the U.S. – have persisted, keeping the possibility of an economic slowdown alive. However, on the whole, our outlook for equity markets in 2024 has not materially changed. Despite the potential for slower growth, we are encouraged by many of the secular trends we’re seeing and, if anything, believe opportunities for stock investors focused on fundamentals may be growing.
AI set to spread and strengthen
As in 2023, artificial intelligence (AI) has been one of the biggest market narratives in 2024. This year, however, the trade has started to evolve. Only five of the “Magnificent 7” mega-cap tech companies that rocketed into the stratosphere last year have continued to see gains in 2024. Meanwhile, other stocks are starting to catch what looks like an AI tailwind.
Since October 2023, for example, utilities have rallied sharply, with the S&P 500® Utilities Sector delivering 29.5%, outperforming the broader S&P 500® Index.1 A recovery trade and the prospect of falling rates likely explain part of the gains. (Utilities trailed the market by their widest margin in decades in 2023.2)
But another reason could be a growing appreciation for the energy demands that AI is creating. The data centers that train and host generative AI programs are expected to account for an estimated 8% of electricity usage in the U.S. by 2030, up from 3% in 2022.3 That, in turn, is forecast to drive sizable investment in energy infrastructure, boosting utilities’ long-term earnings growth potential.
Exhibit 1: Data centers are expected to drive demand for electric power in the U.S.
Composition of U.S. power demand compound annual growth rate (CAGR), 2022-2030
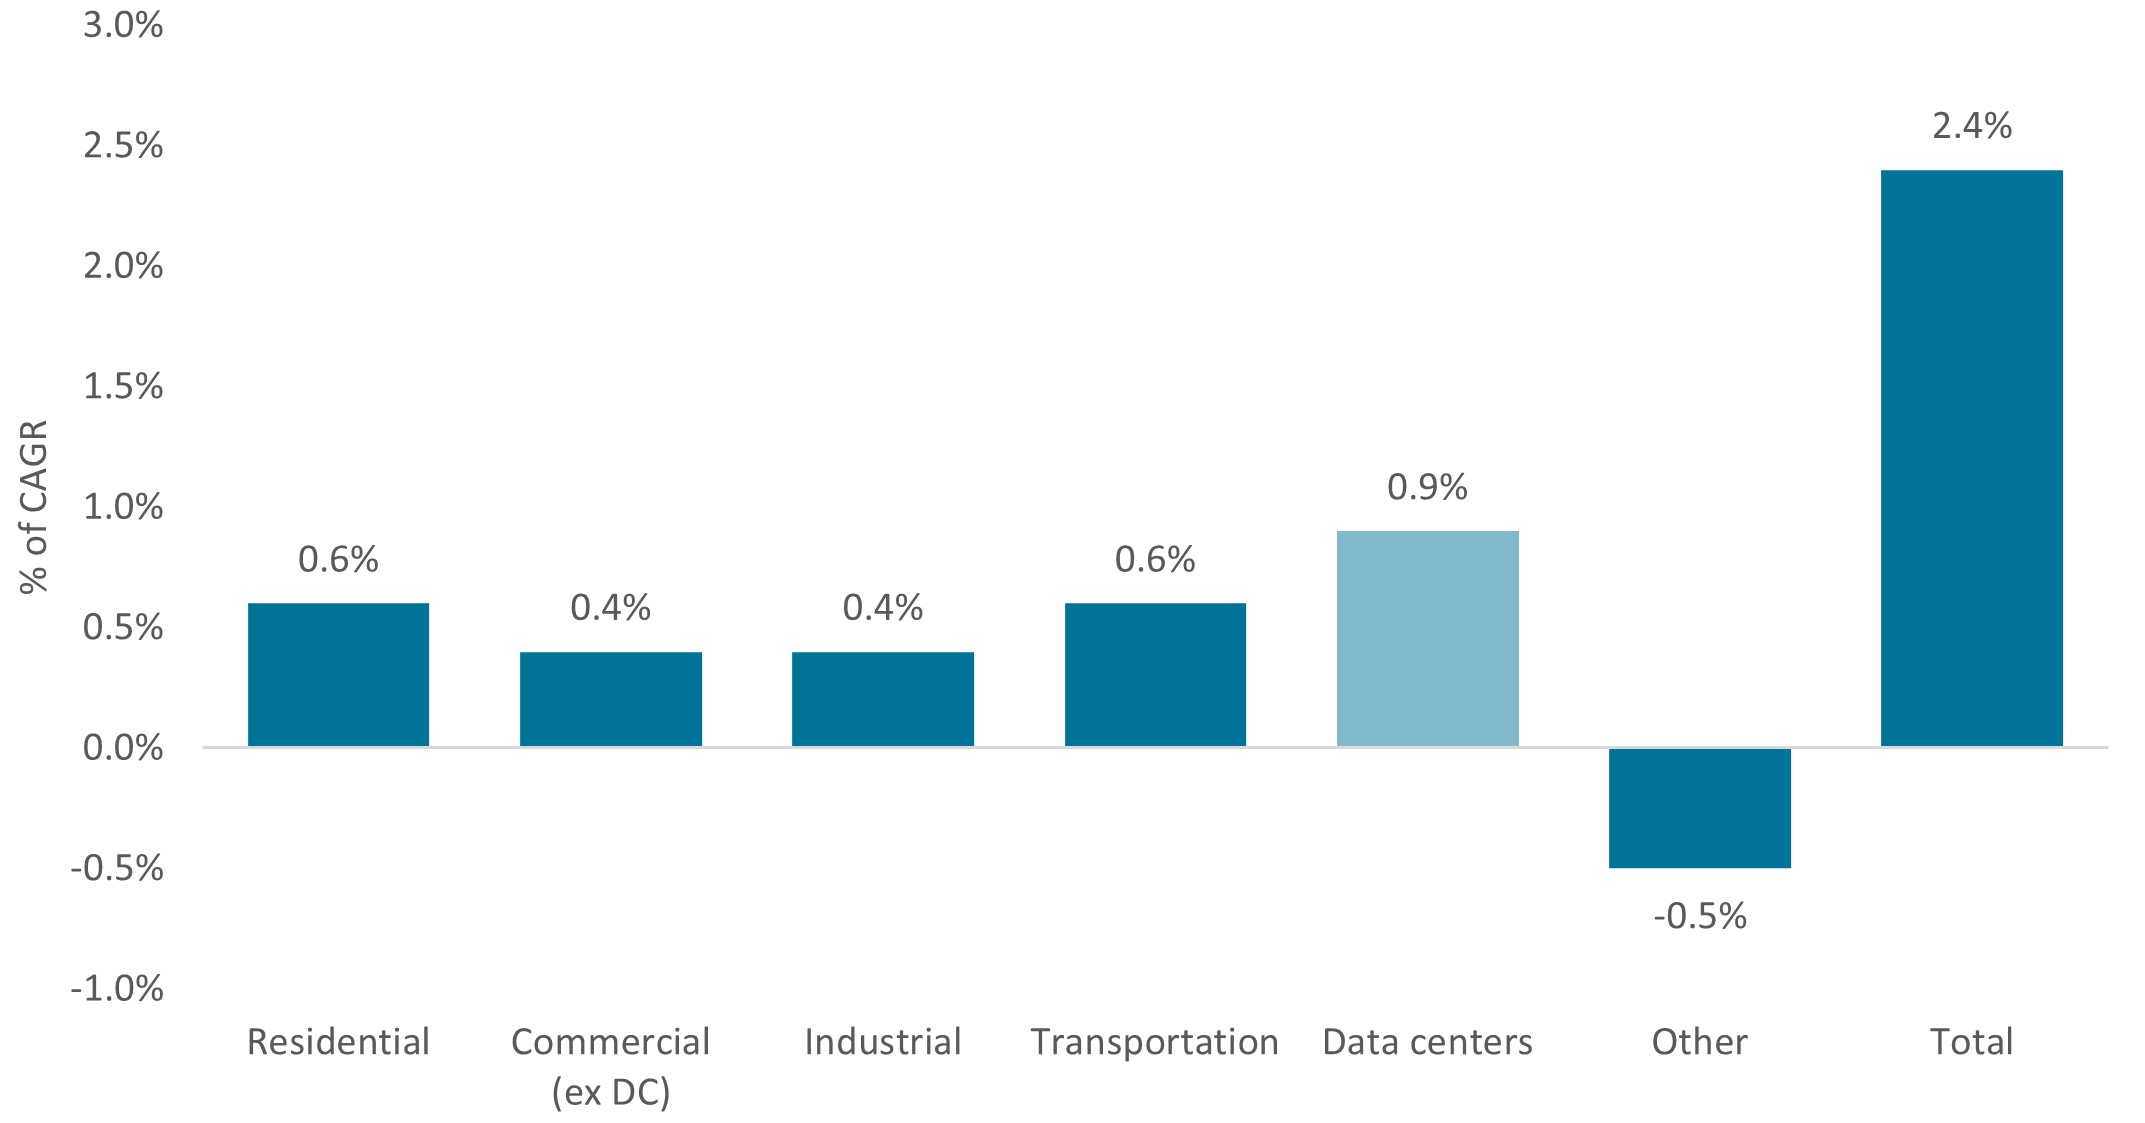
Source: Goldman Sachs Global Investment Research, EIA. As of 28 April 2024.
We see similar stories beginning to play out in other areas of the economy, building a case that AI is still in the early chapters of its story. As such, we believe mega-cap tech companies that continue to invest and innovate in AI could see more revenue and free-cash-flow growth.
The five leaders in the Mag 7 are working quickly to expand what already are wide competitive moats: During the first few months of 2024, year-over-year revenue growth ranged from 13% to 262% among these firms, and management teams announced roughly $200 billion in combined AI capital expenditures for the year.4 That, along with potential rate cuts – which would lower the discount rate of future earnings – could position these stocks for more upside.
At the same time, we think the value of second-derivative AI players will begin to rise. That includes the entire semiconductor ecosystem (from makers of advanced chips to semiconductor equipment manufacturers), companies that offer sustainable water management systems for data centers, energy and electric component suppliers … the list goes on. While these firms may not capture the same headlines as mega-cap tech, AI’s impact on their earnings streams could be no less meaningful.
Valuation gaps come into focus
The continued outperformance of U.S. tech has exacerbated a global gap in equity valuations. In fact, U.S. stocks have led developed market equities for most of the last 16 years, one of the longest stretches in decades.5 As a result, while U.S. equities typically have a price-to-earnings (P/E) ratio above that of other developed markets, the premium now exceeds the average (Exhibit 2).
Exhibit 2: U.S. equities trade at an unusually high premium to other developed markets
Relative price-to-earnings (P/E) ratio of the S&P 500 Index to the MSCI EAFE Index
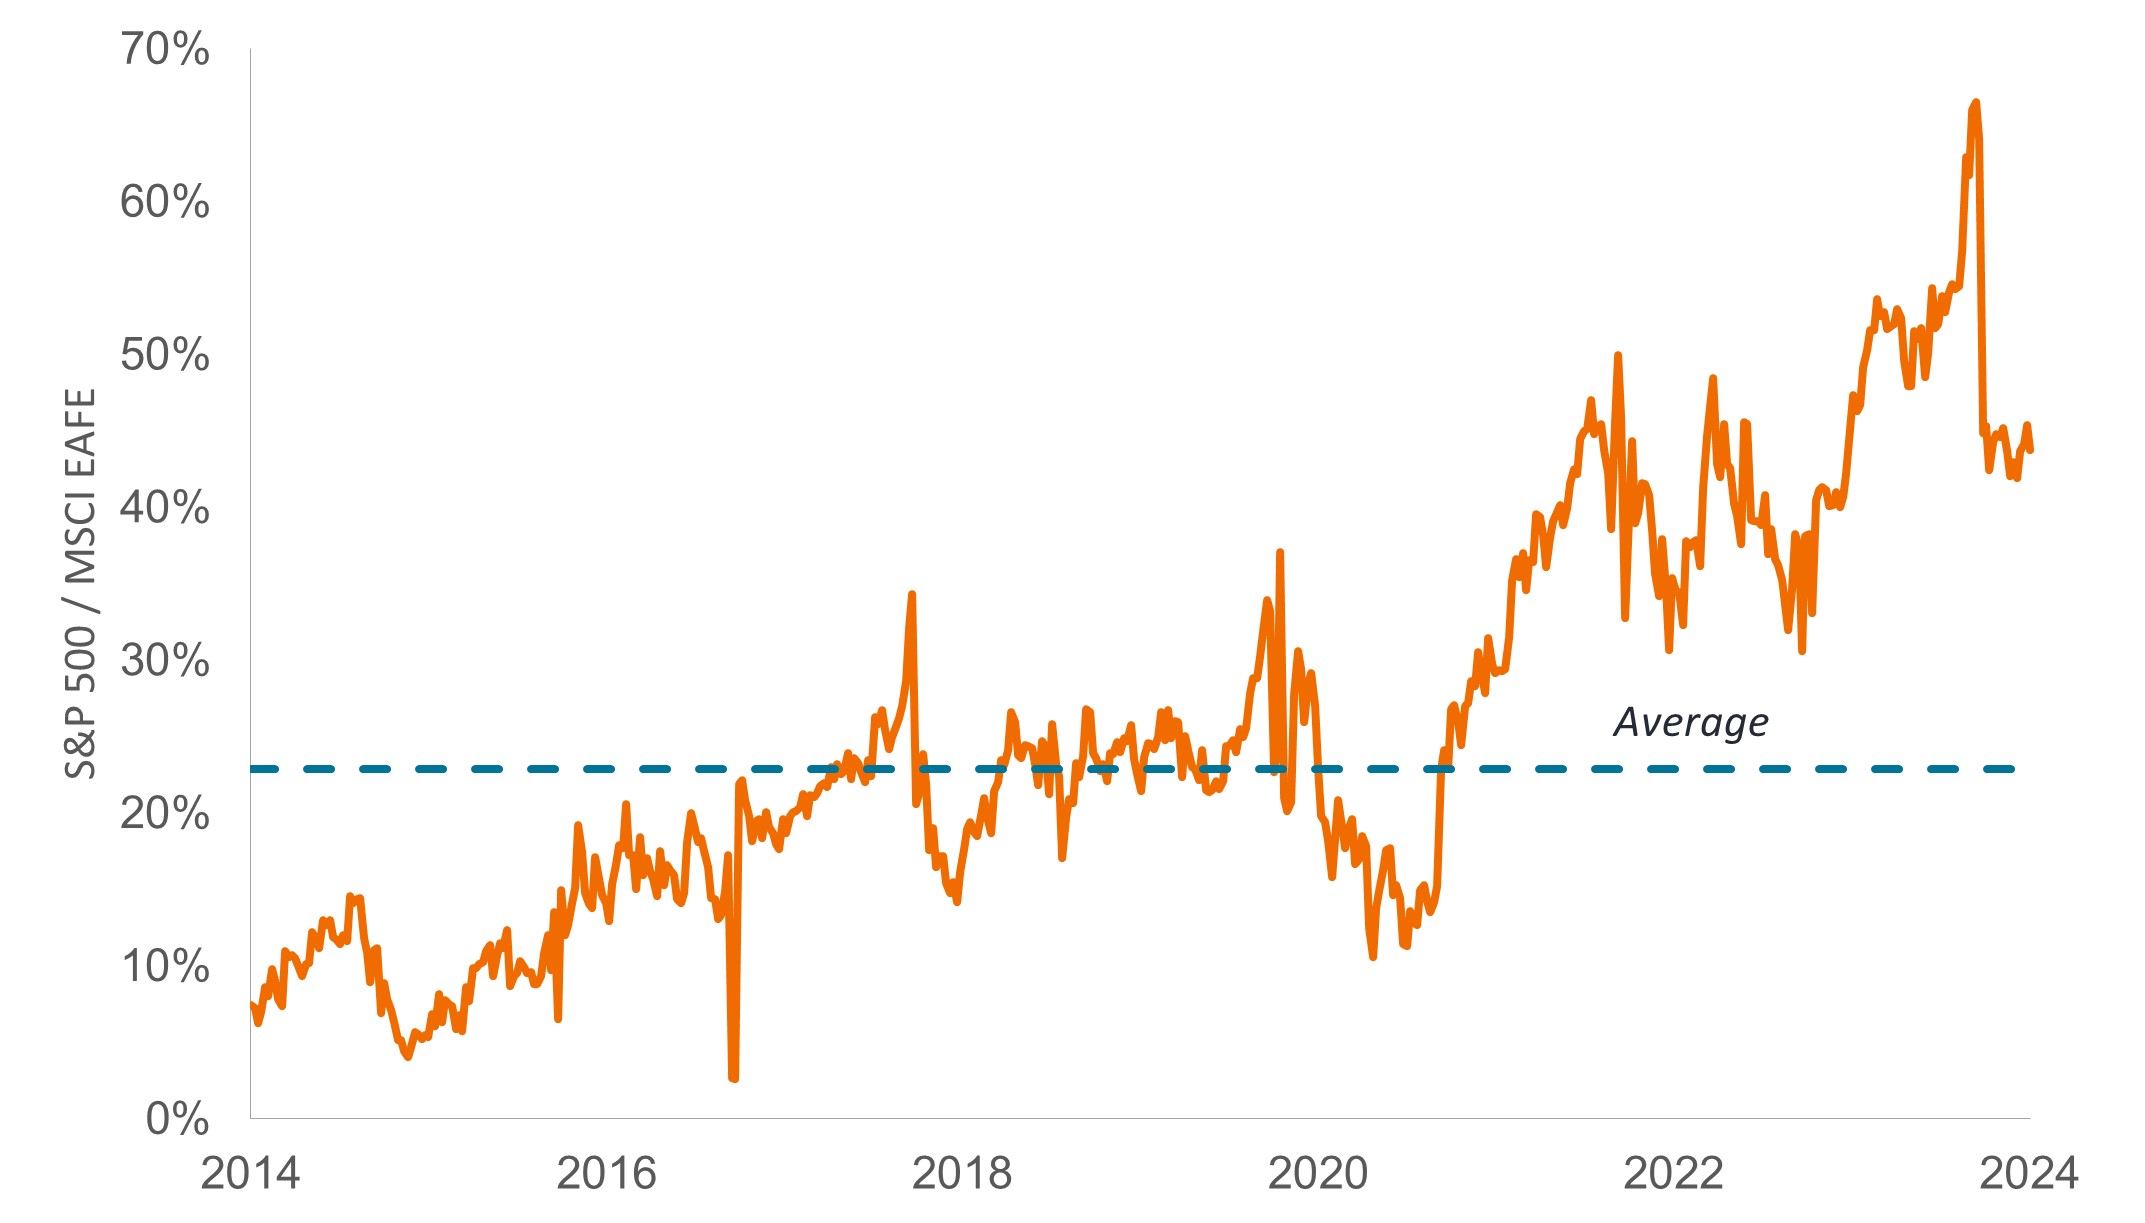
Source: Bloomberg. Data from 30 May 2014 to 31 May 2024. Price-to-earnings ratios (P/E) are based on 12-month estimated earnings. The MSCI EAFE Index is designed to represent the performance of large and mid-cap securities across 21 developed markets, including countries in Europe, Australasia and the Far East, excluding the U.S. and Canada.
The spread has grown so much that any whiff of positive news can lead to big rallies for beaten-down markets. Hong Kong’s Hang Seng Index, for example, was among the worst-performing indices in 2023 (down -10.5%), as well as during the first quarter of 2024 (-2.5%). Then, in mid-April, the benchmark did an about-face, surging more than 20% in one month as news of government stimulus combined with rock-bottom valuations.6
But China is also up against some acute challenges, including a distressed property market, lackluster consumer demand, and mounting trade tensions that threaten to curb Chinese exports – a main driver of recent economic activity. So, while some Chinese corporations have exciting growth stories, an investment strategy based on valuation alone could face near-term volatility.
Non-U.S. markets make a case for themselves
Encouragingly, though, we see fundamentals turning more positive in other markets. In areas where valuation and fundamentals unite, we think potential exists for stocks to rerate higher more consistently.
In Europe, for example, gross domestic product grew faster than expected in the UK and the European Union in the first quarter of 2024.7 Inflation measures also fell, leading Switzerland to kick off rate cuts in March and Sweden in May. And earnings growth improved, with more companies than average beating analyst expectations.8
As such, European indices have traded largely in line with the U.S. year to date (Exhibit 3), and there are reasons to believe the positive momentum can continue: roughly 18 months of inventory destocking in manufacturing is winding down,9 and both the Bank of England and European Central Bank have signaled the potential for at least one rate cut in 2024. Europe has also nurtured its own group of mega-cap leaders in sectors such as healthcare, semiconductors, and retail. And a 62% rise in military spending from a decade ago10 is swelling the order books of European defense contractors.
Exhibit 3: So far this year, European equities have largely kept pace with U.S. stocks
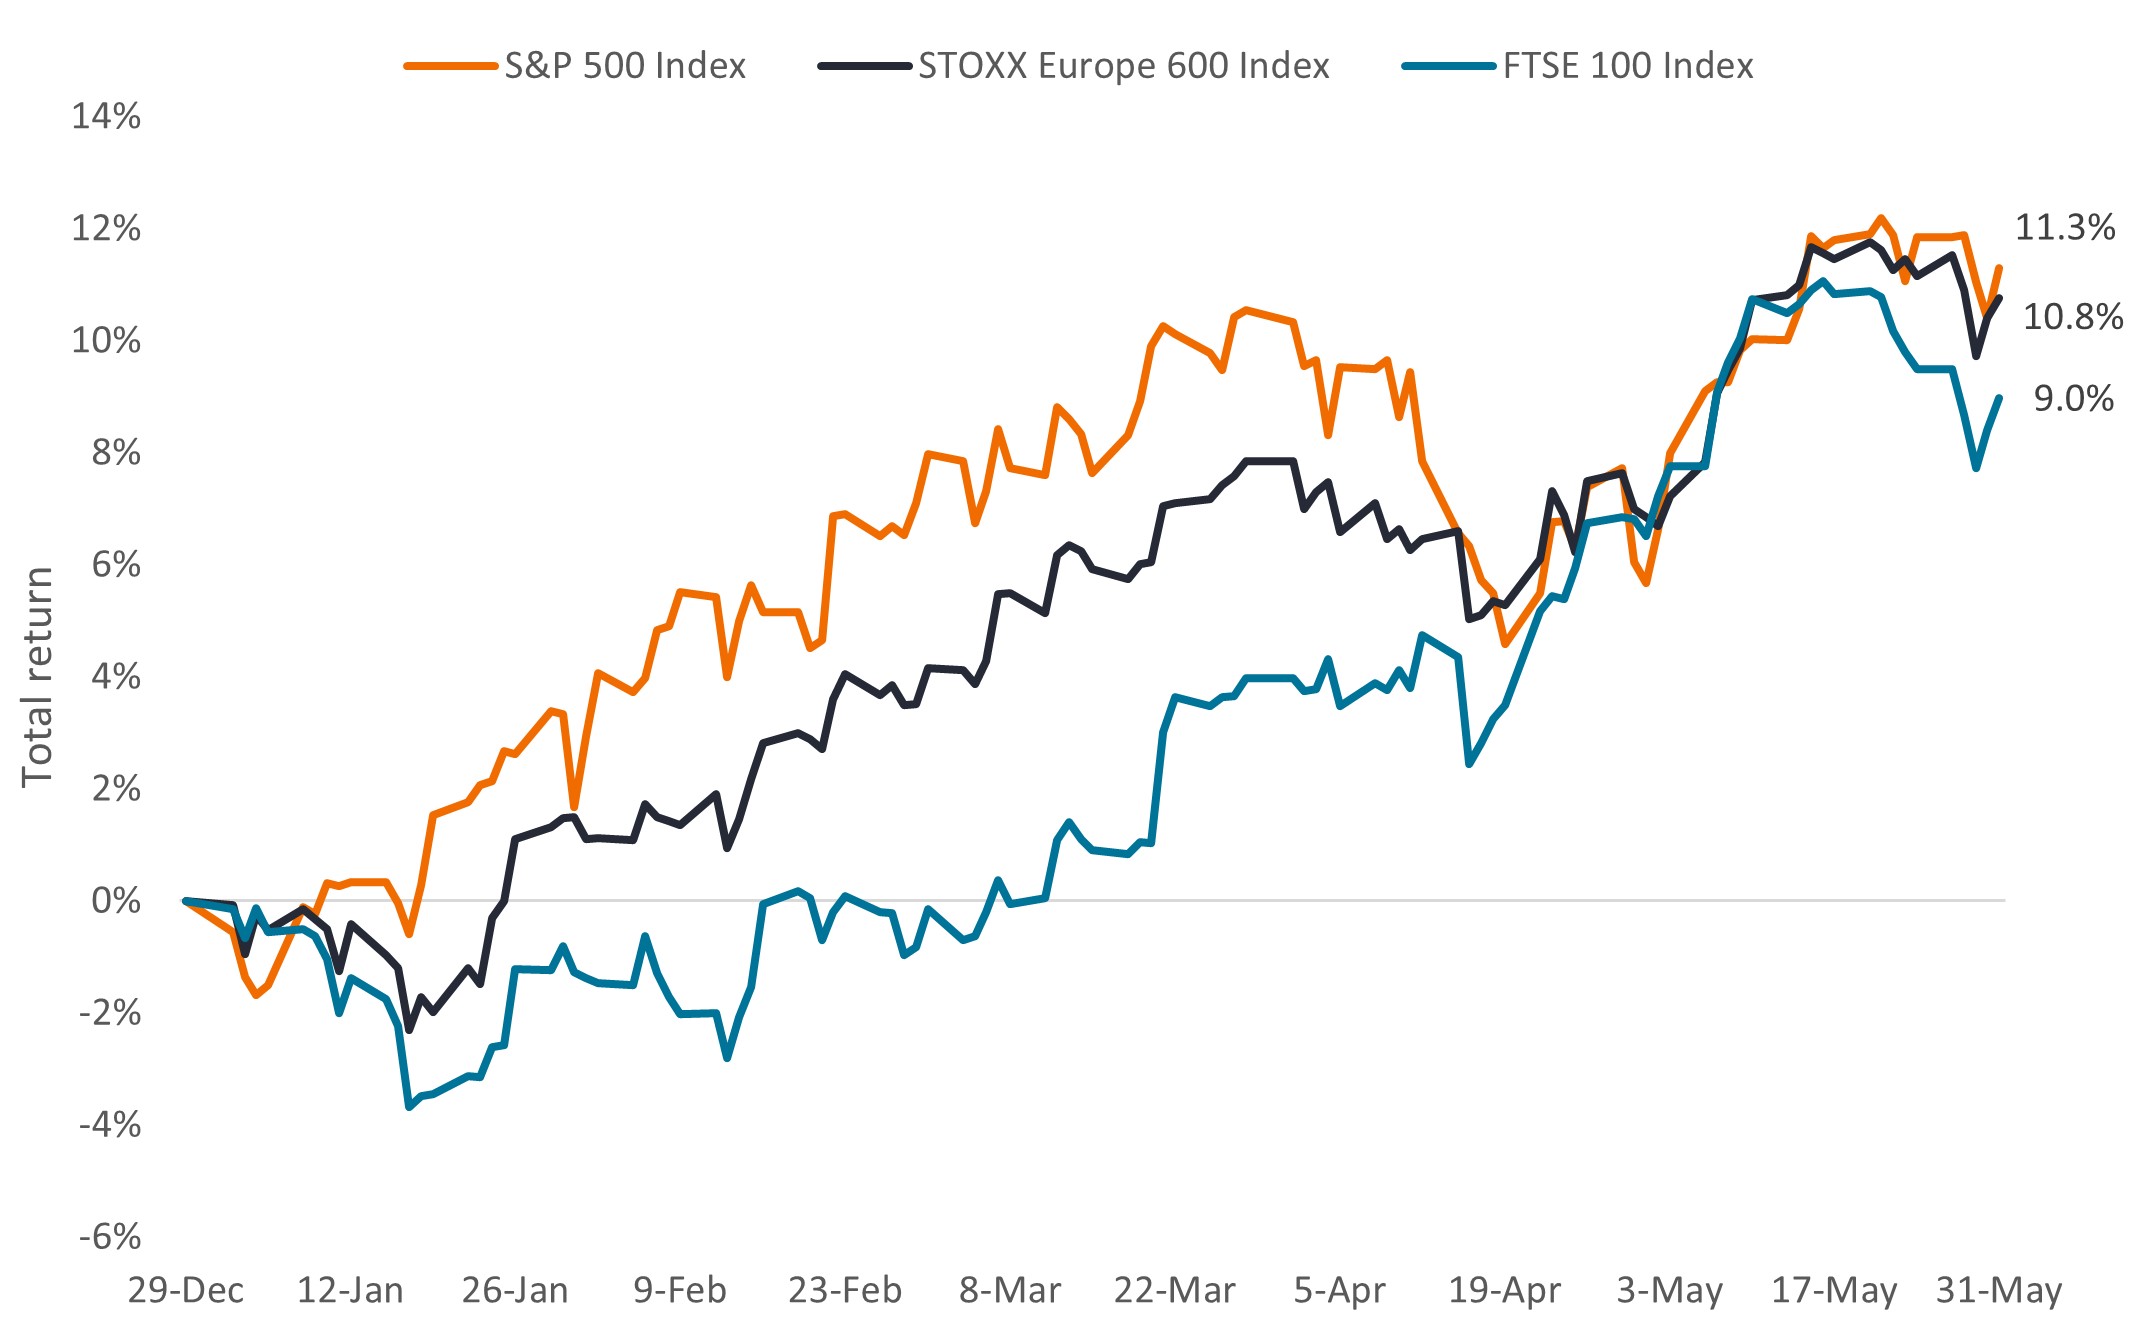
Source: Bloomberg, data from 29 December 2023 to 31 May 2024.
Meanwhile, in Japan, a decade of shareholder-friendly reforms is beginning to bear fruit. In 2023, the Tokyo Stock Exchange finalized a market structuring plan that demanded companies focus on enhancing corporate value and profitability – or risk being delisted. Since then, firms have worked to become more efficient with capital and improve corporate governance. Results are showing: This year, dividends and share buybacks increased at a record pace and common stock ownership has been expanding.
At the same time, inflation has finally reignited in the country, allowing Japanese businesses to raise prices and wages for the first time in decades. These trends, underpinned by still-low valuations for many Japanese equities, have helped drive a reacceleration of Japan’s equity market, with more room to potentially run.
Exhibit 4: A high percentage of Japanese companies still trade at <1x book value, creating room to unlock shareholder value
Price-to-book value*
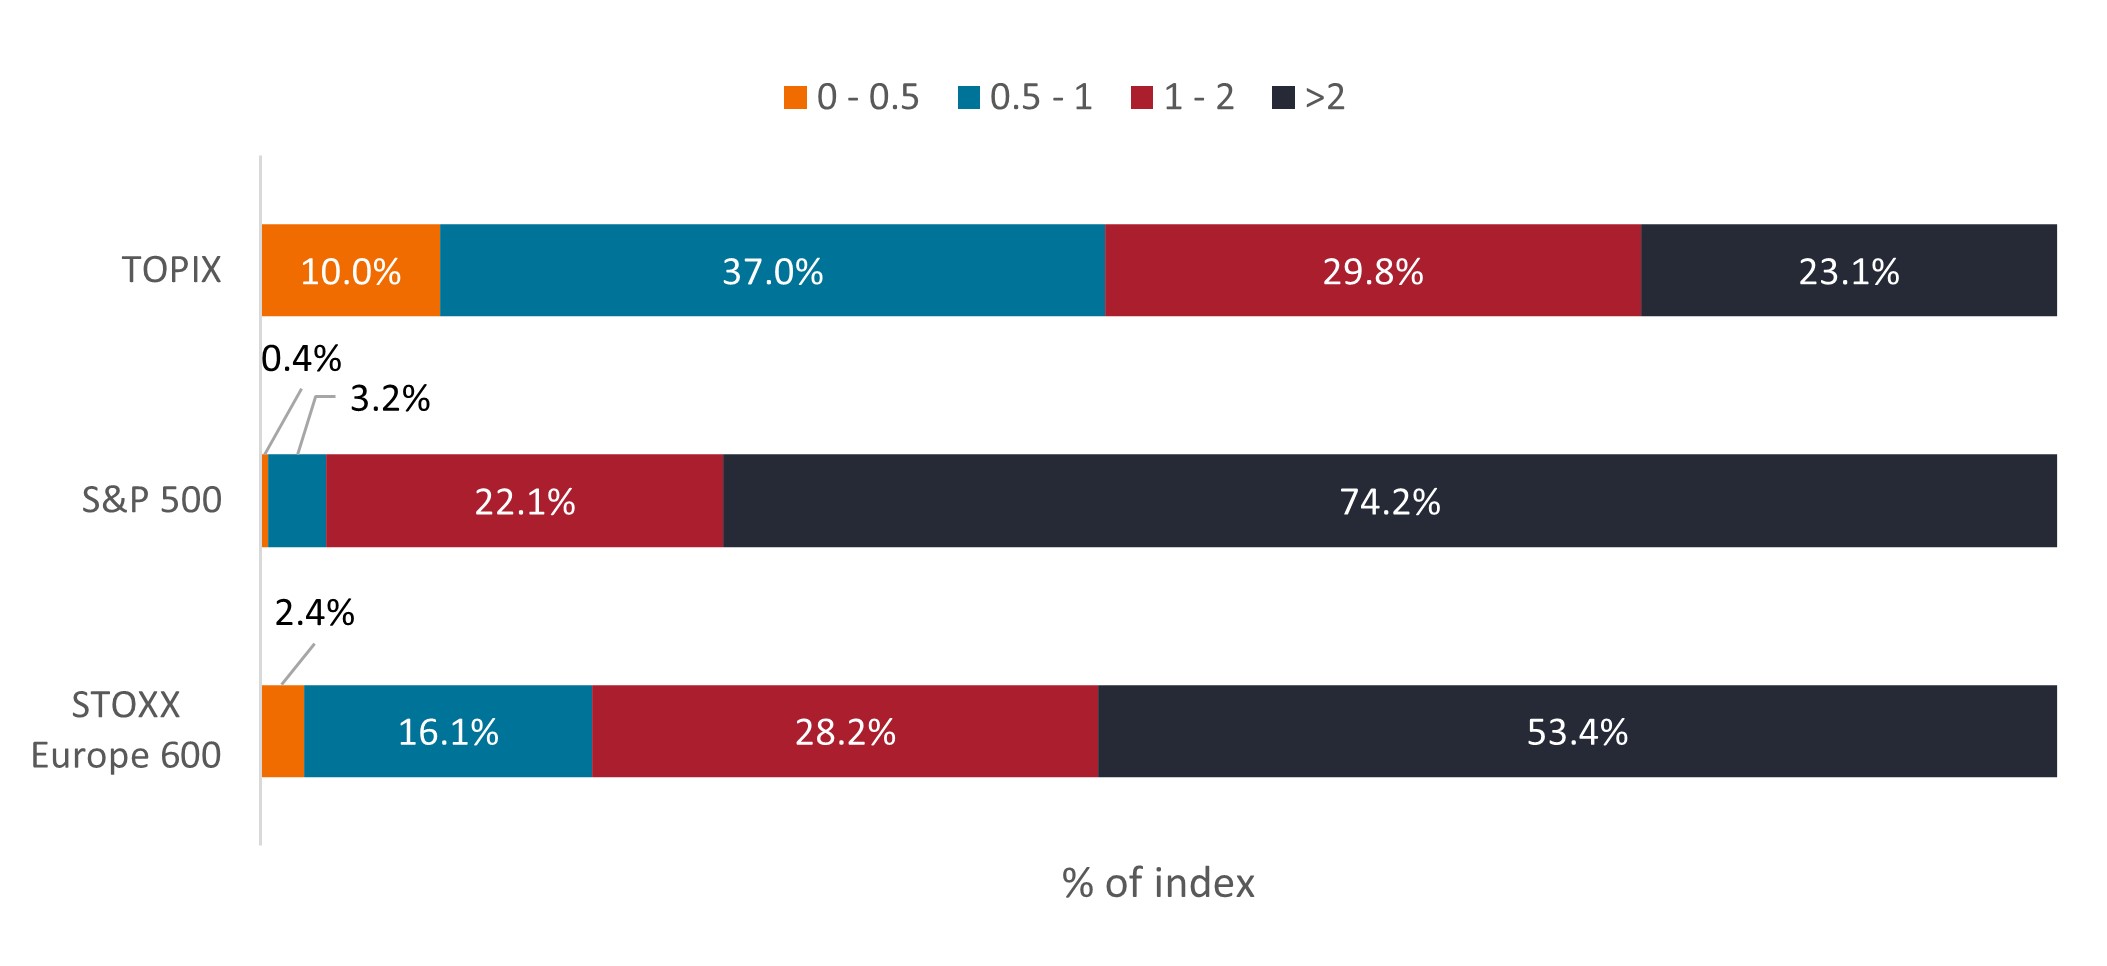 Source: Bloomberg, as of 31 May 2024. *Price-to-book value is the ratio of the market value of a company’s shares (share price) over its book value of equity. The TOPIX, also known as the Tokyo Stock Price Index, is a capitalization-weighted index of all companies listed on the First Section of the Tokyo Stock Exchange.
In emerging markets, India is taking steps to become an alternative manufacturing hub for global trade. The 2019 National Policy on Electronics, for example, introduced new incentives to encourage production of core electronic components (including chipsets, optical fibers, and components for clean energy). That was followed by the Production Linked Incentive scheme in 2020, which provides subsidies for expanding manufacturing capacity across multiple industries, including automotive, pharmaceuticals and medical devices, solar energy, and electronics. Both programs, when combined with India’s low cost of labor, infrastructure investments, and pro-business environment, have led to a rise in foreign and domestic investment in India that we think is only just beginning.
Opportunities outside the Mag 7
In the U.S., worries continue about stretched valuations, but we see reason to be positive. While the market-capitalization weighted S&P 500 has a forward price-to-earnings (P/E) ratio of 21, the forward P/E of the equal-weight version of the Index is a more reasonable 16, especially given current interest rate levels.11 The difference reflects the large weighting big tech has in the benchmark.
For the rest of the S&P 500, earnings growth declined on average during the first quarter,12 which helped to cap valuations. Even so, consensus forecasts expect profits to reaccelerate over the remainder of year, resulting in overall positive earnings growth for calendar year 2024. We take a similar view but also note uncertainties around consumer spending, the timing and number of potential rate cuts, and geopolitical tensions. As such, we continue to think investors should focus on high-quality firms whose growth is not dependent on the economic cycle, can generate strong free cash flow, and have reasonable debt levels.
Today, we think one sector that offers many of these attributes is healthcare. After a multiyear bear market, many biotechnology stocks still trade below the value of cash on their balance sheets (Exhibit 4). Meanwhile, the broader healthcare sector’s total return lagged the S&P 500’s by more than 20 percentage points in 2023, suffering from a sharp slowdown in COVID-19-related product sales.13
Exhibit 5: Biotech companies on sale
Number of life sciences companies worldwide with a negative enterprise value*
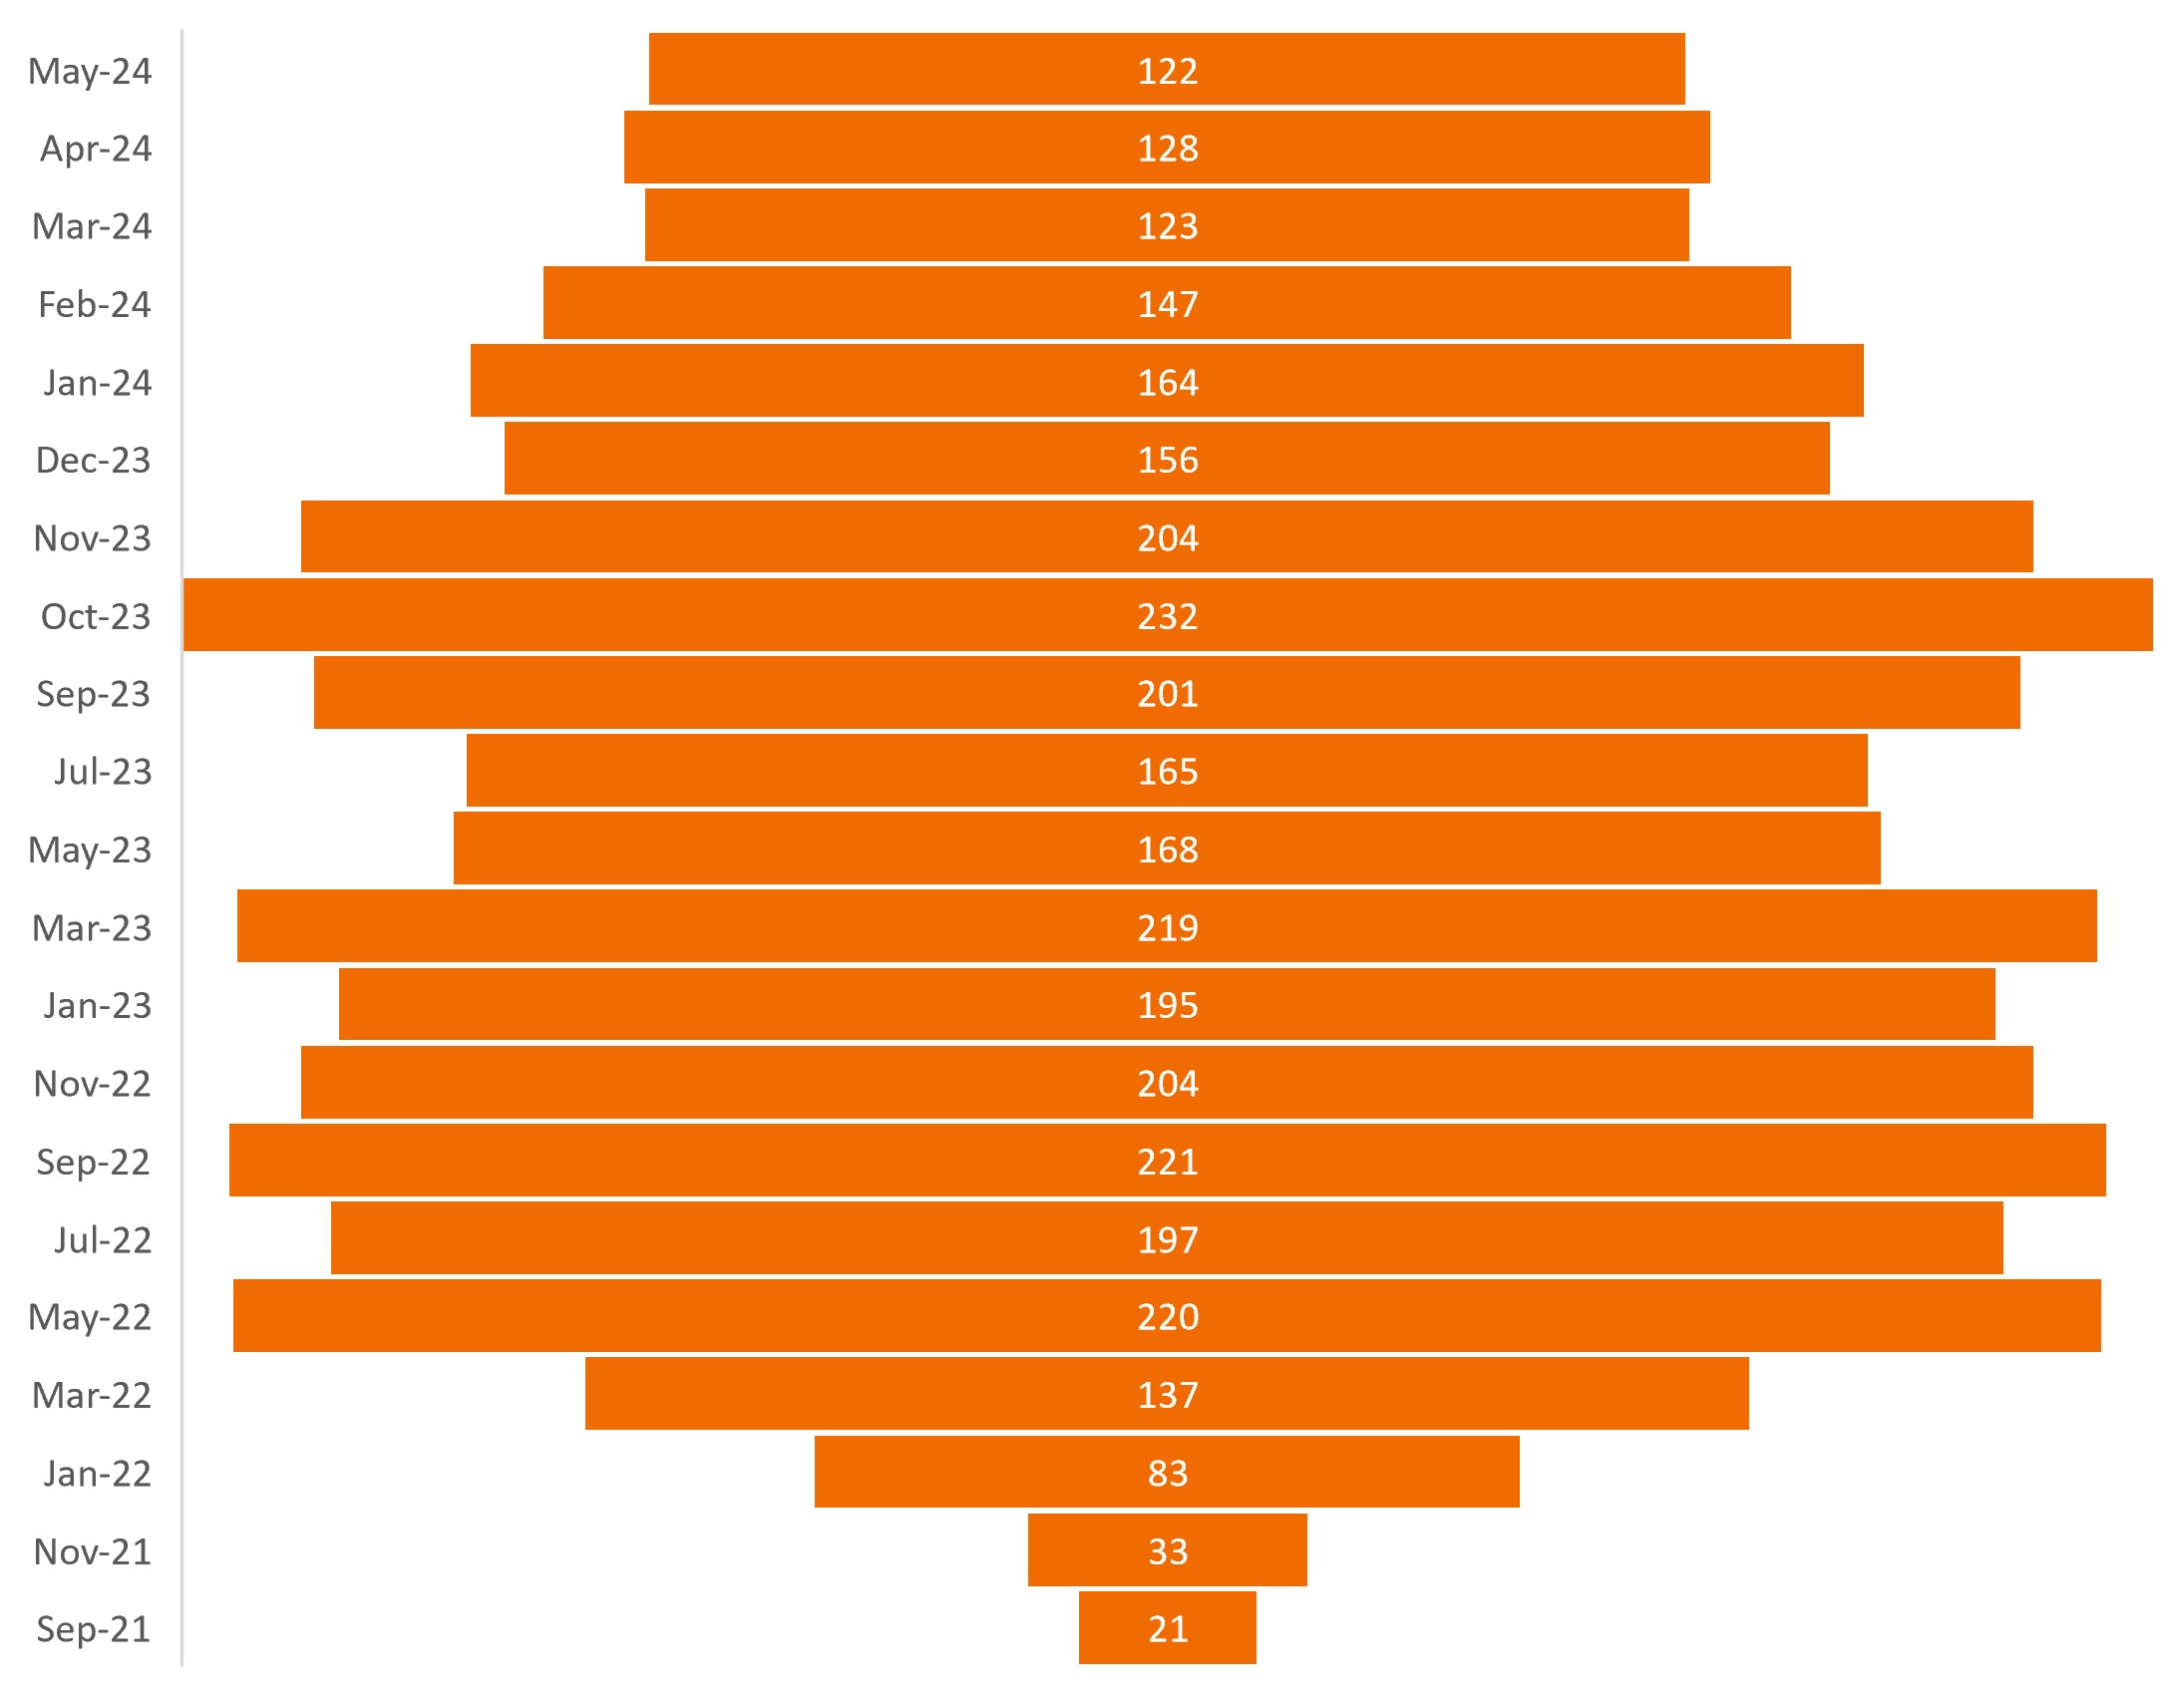
Source: CapitalIQ, Stifel, data as of 24 May 2024. * Enterprise value is the value of a firm equal to its equity value, plus net debt, plus any minority interest.
And yet, the healthcare sector is ripe with innovation. Last year, the Food and Drug Administration approved a record 73 novel medicines.14 These drugs are now beginning what will likely be a 10-year revenue cycle, including in new end markets with multibillion-dollar sales potential. Recently approved GLP-1 drugs for diabetes and weight loss, for example, are already annualizing more than $30 billion in revenue and are forecast to reach roughly $100 billion in sales by the end of the decade.15
A good time for fundamental investing
In short, although the first half of 2024 was surprising in many ways, we think it has helped to highlight opportunities around valuation and fundamentals. Both could come into even sharper focus over the next six months as investors reckon with ongoing inflation measures, central bank policy moves, geopolitical tensions, and uncertainty around the U.S. election.
However, as we said at the outset, we remain encouraged by the outlook for equities. In our view, the potential for shareholder value has grown more compelling across a number of areas of the global market.
1 Bloomberg, data from 6 October 2023 to 31 May 2024. The S&P 500 returned 23.7%.
2 Anderson, Rob. “Can we trust the Utilities turnaround? (Ned Davis Research, 9 May 2024)
3 “AI, data centers and the coming US power demand surge” (Goldman Sachs, 28 April 2024)
4 Company filings (Amazon, Alphabet, Meta, Microsoft, and Nvidia). Data are for the three-month period ended 31 March 2024, except for Nvidia whose quarterly period ended 28 April 2024.
5 “Guide to the Markets, U.S. Q2 2024,” JPMorgan Asset Management, as of 31 March 2024. Data reflect rolling, 12-month periods of outperformance of MSCI USA vs. MSCI EAFE. The MSCI USA Index is designed to measure the performance of the large- and mid-cap segments of the U.S. market. With 612 constituents, the index covers approximately 85% of the free float-adjusted market capitalization in the U.S. The MSCI EAFE Index is designed to represent the performance of large- and mid-cap securities across 21 developed markets, including countries in Europe, Australasia and the Far East, excluding the U.S. and Canada.
6 Bloomberg, data from 19 April 2024 to 20 May 2024. The Hang Seng Index is a free-float market capitalization-weighted index of the largest companies that trade on the Hong Kong Exchange.
7 European Commission, “Spring 2024 Economic Forecast: A gradual expansion amid high geopolitical risks,” 15 May 2024.
8 LSEG. Based on companies in the STOXX 600 that had reported Q1 2024 earnings as of 14 May 2024.
9 “Steel destocking ends in Europe but customers still cautious, ArcelorMittal says,” (EUROMETAL 3 May 2024); “European chemicals: destocking done, now what?” (Reuters 4 April 2024)
10 Tian, Nan; Diego Lopes, et.al. “Trends in World Military Expenditure, 2023” (SIPRI April 2024). Data reflect change in spending from 2014 to 2023.
11 Bloomberg, as of 31 May 2024.
12 Butters, John, “Are the Magnificent 7 the Top Contributors to Earnings Growth for the S&P 500 for Q1?” (FactSet, 22 April 2024)
13 Bloomberg. Data are for the S&P 500 Health Care Sector and the S&P 500 Index, from 30 December 2022 to 29 December 2023. The S&P 500 Health Care comprises those companies included in the S&P 500 that are classified as members of the GICS® health care sector.
14 Food and Drug Administration, as of 31 December 2023.
15 Janus Henderson Investors, as of 31 December 2023.
10-Year Treasury Yield is the interest rate on U.S. Treasury bonds that will mature 10 years from the date of purchase.
Free cash flow (FCF) yield is a financial ratio that measures how much cash flow a company has in case of its liquidation or other obligations by comparing the free cash flow per share with the market price per share and indicates the level of cash flow the company will earn against its share market value.
An inverted yield curve occurs when short-term yields are higher than long-term yields.
Monetary Policy refers to the policies of a central bank, aimed at influencing the level of inflation and growth in an economy. It includes controlling interest rates and the supply of money.
Premium/Discount indicates whether a security is currently trading above (at a premium to) or below (at a discount to) its net asset value.
Price-to-Earnings (P/E) Ratio measures share price compared to earnings per share for a stock or stocks in a portfolio.
S&P 500® Index reflects U.S. large-cap equity performance and represents broad U.S. equity market performance.
Volatility measures risk using the dispersion of returns for a given investment.
IMPORTANT INFORMATION
Concentrated investments in a single sector, industry or region will be more susceptible to factors affecting that group and may be more volatile than less concentrated investments or the market as a whole.
Health care industries are subject to government regulation and reimbursement rates, as well as government approval of products and services, which could have a significant effect on price and availability, and can be significantly affected by rapid obsolescence and patent expirations.
Technology industries can be significantly affected by obsolescence of existing technology, short product cycles, falling prices and profits, competition from new market entrants, and general economic conditions. A concentrated investment in a single industry could be more volatile than the performance of less concentrated investments and the market as a whole.
These are the views of the author at the time of publication and may differ from the views of other individuals/teams at Janus Henderson Investors. References made to individual securities do not constitute a recommendation to buy, sell or hold any security, investment strategy or market sector, and should not be assumed to be profitable. Janus Henderson Investors, its affiliated advisor, or its employees, may have a position in the securities mentioned.
Past performance does not predict future returns. The value of an investment and the income from it can fall as well as rise and you may not get back the amount originally invested.
The information in this article does not qualify as an investment recommendation.
There is no guarantee that past trends will continue, or forecasts will be realised.
Marketing Communication.
10 minute read
Key takeaways:
- U.S. mega-cap tech firms continued to lead global equity markets in the first half of 2024, but other areas of the market showed signs of benefiting from innovation, policy reform, and comparatively attractive valuations.
- In our view, the trend points to a broadening of equity opportunities for the remainder of 2024.
- We believe investors should look for a combination of fundamentals and valuation, especially amid elevated interest rates and other risks to economic growth.

