High yield bond spreads: What you see is NOT what you get
Fixed income portfolio managers Tom Ross and Brent Olson look at the credit spread on high yield bonds and explore why it is distorted and potentially wider than it first appears.

8 minute read
Key takeaways:
- A criticism of the high yield bonds market is that while yields are relatively high, spreads are relatively low (tight), but there are specific market factors that are contributing to this.
- The high yield market is better quality today, which compresses spreads, while the peculiarity of refinancings taking place with bonds trading well below par can create a spread uplift for investors when bonds are called.
- By being selective, there are opportunities to identify bonds that may be called early and potentially benefit from the uplift.
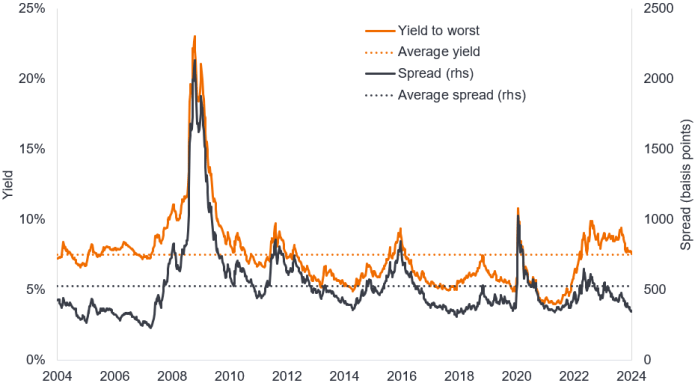
Compared to the past decade or so, the yield on high yield corporate bonds currently appears attractive, with yields typically in the range of 6-8%. In fact, yields are trading close to the 20-year average that incorporates the high yields during and surrounding the Global Financial Crisis. A common question we receive, however, when speaking with investors is that while yields are high, is that not just because government bond yields are high, surely credit spreads are near their tights?
JHI
The credit spread is the difference in yield between a corporate bond and a government bond of the same maturity. It is essentially the extra yield that an investor receives for taking on the risk that the corporate bond might default (i.e., fail to meet the interest and principal repayment on the bond). A cursory glance at the credit spread on high yield bonds does suggest that spreads are near their tights (lows), although they are still some way above the lows reached in 2018 and the early 2000s.
Figure 1: Yield and spread on global high yield bonds over the last 20 years

Source: Bloomberg, ICE BofA Global High Yield Index, yield to worst, government option adjusted spread (OAS), 5 March 2004 to 8 March 2024. The yield to worst is the lowest yield a bond (index) can achieve provided the issuer(s) does not default; it takes into account special features such as call options (that give issuers the right to call back a bond at specified dates). Basis point (bp) equals 1/100 of a percentage point, 1bp = 0.01%. Yields may vary and are not guaranteed.
Optically, therefore, spreads appear tight, but we think this fails to take into account two factors.
Higher credit quality
First, improved credit quality. BB-rated bonds – the better quality cohort – make up a higher proportion of the high yield bond market than 10 years ago and even more so than 20 years ago. Since investors would demand a higher yield and spread to invest in lower rated bonds (CCC or lower) that are closer to distress, it stands to reason that, all else being equal, an index today with a smaller weight in lower rated bonds ought to have a tighter spread.
Figure 2: Weight in each rating cohort in European and US high yield

Source: Bloomberg, ICE BofA European Currency High Yield Index, ICE BofA US High Yield Index, based on full market value weights at month end, 29 February 2024.
Clearly, there are other factors that can affect spread levels. For example, Europe currently trades with wider (higher) spreads than the US, even though its high yield bond market is rated better quality. Reasons for this include the fact that government bond yields are lower in Europe so to attract global capital, spreads are a bit higher. Additionally, it could reflect the relative strengths of the European and US economies, with the weaker European economy leading to investors demanding a little more spread to lend to European companies.
Pull to par
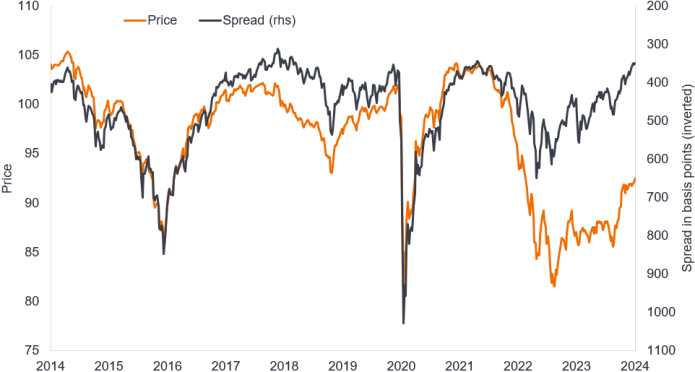
A second factor for tight spreads is the fact that bond prices are trading well below par. It is rare for credit spreads to be tight and bond prices to be so low.
Figure 3: Unusual regime of tight spreads and low prices within global high yield

Source: Bloomberg, ICE BofA Global High Yield Bond Index, bond price, government option adjusted spread (OAS), 7 March 2004 to 8 March 2024. Basis point (bp) equals 1/100 of a percentage point, 1bp = 0.01%. Yields may vary over time and are not guaranteed.
This creates a pull to par effect (bonds typically move towards their par value the closer they get to their maturity date). There is also the prospect of a beneficial effect from early refinancing, which would enhance investor returns. It can be common for bond issuers to issue callable bonds. These are bonds that allow the bond issuer to redeem (call) the bond early. In an environment of lower yields, an early call would usually be disadvantageous to investors as it would mean investors having to reinvest in bonds with lower coupons (the interest rate paid by the bond). Today, however, yields and coupons are typically higher than they have been for the last few years so investors can often reinvest at a similar or higher coupon.
If we look at Company A you can see the effect an early call has on the yield that an investor would experience. With the bond trading below par, an early call will result in a higher yield, so the worst call date (from a bond investor’s viewpoint) becomes the maturity date. The yield to maturity and yield to worst in this case are therefore identical. The earlier the call, the bigger the impact on the yield as investors benefit from the accelerated capital uplift from receiving par early (plus any coupon prior to the call date).
Figure 4: Company A, 3.25% coupon, matures 16 February 2026

Source: Bloomberg, illustrative example replicating data for an actual company, 27 February 2023. The yield to maturity takes into account the coupon and any capital gain/loss from the difference between the bond’s current price and the par value. The yield to worst is the lowest yield a bond with a special feature (such as a call option) can achieve provided the issuer does not default. There is no guarantee that past trends will continue, or forecasts will be realised.
Why refinance early?
If borrowing rates today are lower than a company’s existing financing costs, there is an obvious incentive for a company to refinance a bond. But why should a bond issuer want to call their bonds early if the coupon would be the same or higher? Why not wait until maturity? Most high yield bonds are typically refinanced at least one year before maturity. There are several reasons why companies tend to move earlier:
- Companies do not want to leave refinancing to the last minute in case they have difficulty rolling over the debt. No one knows exactly what the market environment might be near to the maturity date, for example, capital markets might be closed as happened at the height of the Global Financial Crisis or the recent Covid pandemic. Refinancing earlier gives the company more flexibility.
- Most companies prefer to keep debt sitting within ‘long-term liabilities’ on their balance sheets so that their accounting ratios look better. Debt that must be paid back within 12 months is treated as a ‘current liability’ under accounting treatment, so companies are often keen to refinance debt to avoid it moving into current liability.
- From a signalling perspective, a successful refinancing can help with the market opinion of the company because it removes a near-term risk, potentially helping to protect or improve a company’s credit rating.
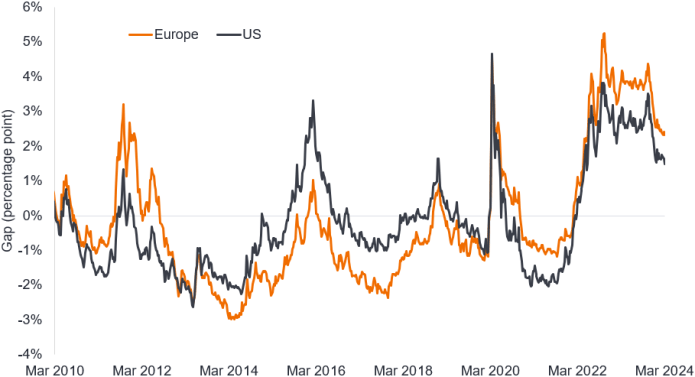
Recently, we have seen a drift down in the gap between the index yield and the average coupon. The gap is still positive meaning that refinancing rates are still typically in excess of existing coupons but the potential change in coupon feels a lot more palatable to companies than it was a year ago.
Figure 5: Gap between the index yield and the coupon has reduced recently

Source: Bloomberg, ICE BofA European Currency Non-Financial 2% Constrained, ICE BofA US High Yield, yield to worst minus weighted average coupon, 8 March 1999 to 8 March 2024.
Some companies have held off refinancing since 2022, hoping that rate cuts would commence. But with the clock ticking down to maturities in the next couple of years, many will call early to avoid the debt becoming current liabilities.
Substitution effect
Over the next 12-18 months a substitution effect should, therefore, be taking place in the high yield index as bond issuers like Company A refinance their existing bonds. This will lead to a higher spread as bonds with lower coupons are replaced.
Spreads therefore appear tight, but we see this as an artificial level. As bonds are called and refinanced, we should see a rise in spreads. By being selective we can seek to capture the uplift by identifying these bonds.
The ICE BofA European Currency High Yield Index tracks the performance of EUR and GBP denominated below investment grade corporate debt publicly issued in the eurobond, sterling domestic or euro domestic markets.
The ICE BofA European Currency Non-Financial High Yield 2% Constrained Index contains all non-Financial securities in the ICE BofA European Currency High Yield Index but caps issuer exposure at 2%.
The ICE BofA Global High Yield Index tracks the performance of USD, CAD, GBP and EUR denominated below investment grade corporate debt publicly issued in the major domestic or eurobond markets.
The ICE BofA US High Yield Index tracks the performance of US dollar denominated below investment grade corporate debt publicly issued in the US domestic market.
Accounting ratios: The comparison of two or more financial data which are used for analysing the financial statements of companies.
Balance sheet: A financial statement that summarises a company’s assets, liabilities and shareholders’ equity at a particular point in time.
Call: A callable bond is a bond that can be redeemed (called) early by the issuer prior to the maturity date.
Cash flow: The net amount of cash and cash equivalents transferred in and out of a company.
Corporate fundamentals are the underlying factors that contribute to the price of an investment. For a company, this can include the level of debt (leverage) in the company, its ability to generate cash and its ability to service that debt.
Credit rating: A score given by a credit rating agency such as S&P Global Ratings, Moody’s and Fitch on the creditworthiness of a borrower. For example, S&P ranks investment grade bonds from the highest AAA down to BBB and high yields bonds from BB through B down to CCC in terms of declining quality and greater risk, i.e. CCC rated borrowers carry a greater risk of default.
Credit spread is the difference in yield between securities with similar maturity but different credit quality. Widening spreads generally indicate deteriorating creditworthiness of corporate borrowers, and narrowing indicate improving.
Default: The failure of a debtor (such as a bond issuer) to pay interest or to return an original amount loaned when due.
High yield bond: Also known as a sub-investment grade bond, or ‘junk’ bond. These bonds usually carry a higher risk of the issuer defaulting on their payments, so they are typically issued with a higher interest rate (coupon) to compensate for the additional risk.
Inflation: The rate at which prices of goods and services are rising in the economy.
Investment-grade bond: A bond typically issued by governments or companies perceived to have a relatively low risk of defaulting on their payments, reflected in the higher rating given to them by credit ratings agencies.
Maturity: The maturity date of a bond is the date when the principal investment (and any final coupon) is paid to investors. Shorter-dated bonds generally mature within 5 years, medium-term bonds within 5 to 10 years, and longer-dated bonds after 10+ years.
Par value: The original value of a security, such as a bond, when it is first issued. Bonds are usually redeemed at par value when they mature. Par value is typically quoted as 100. If a bond’s price is trading at say 105, it would be trading above par value, whereas if it was at say 90, it would be trading below par value.
Refinancing: The process of revising and replacing the terms of an existing borrowing agreement, including replacing debt with new borrowing before or at the time of the debt maturity.
Total return: This is the return on an asset or investment that takes into account both income and any capital gain/loss.
Yield: The level of income on a security over a set period, typically expressed as a percentage rate. For a bond, at its most simple, this is calculated as the coupon payment divided by the current bond price.
Yield to maturity. The yield to maturity is the expected annualised rate of return earned by an investor who buys a bond at the market price and holds it until maturity. Mathematically, it is the discount rate at which the sum of all future cash flows (from coupons and principal repayment) equals the price of the bond.
Yield to worst. The lowest yield a bond with a special feature (such as a call option) can achieve provided the issuer does not default. When used to describe a portfolio, this statistic represents the weighted average across all the underlying bonds held.
Volatility measures risk using the dispersion of returns for a given investment. The rate and extent at which the price of a portfolio, security or index moves up and down.
IMPORTANT INFORMATION
Fixed income securities are subject to interest rate, inflation, credit and default risk. The bond market is volatile. As interest rates rise, bond prices usually fall, and vice versa. The return of principal is not guaranteed, and prices may decline if an issuer fails to make timely payments or its credit strength weakens.
High-yield or “junk” bonds involve a greater risk of default and price volatility and can experience sudden and sharp price swings.
These are the views of the author at the time of publication and may differ from the views of other individuals/teams at Janus Henderson Investors. References made to individual securities do not constitute a recommendation to buy, sell or hold any security, investment strategy or market sector, and should not be assumed to be profitable. Janus Henderson Investors, its affiliated advisor, or its employees, may have a position in the securities mentioned.
Past performance does not predict future returns. The value of an investment and the income from it can fall as well as rise and you may not get back the amount originally invested.
The information in this article does not qualify as an investment recommendation.
There is no guarantee that past trends will continue, or forecasts will be realised.
Marketing Communication.