Divergence creates opportunities in global investment grade in 2025
Global fragmentation is deepening, with economies on different paths. In contrast, there isn’t much dispersion in investment grade markets. Portfolio managers James Briggs and Tim Winstone explain why this is likely to change in 2025.

8 minute read
Key takeaways:
- Global economic fragmentation is intensifying, highlighted by divergent monetary policies and growth rates and exacerbated by trade frictions and political change.
- This is inciting concerns about global growth while creating bond market pricing dislocation opportunities. For credit investors, strong economic growth isn’t a prerequisite for attractive total returns and with investment grade (IG) yields back to pre-GFC levels, this could be a positive environment for performance.
- In IG credit, a lack of dispersion plays into an active approach to find the right credits. With inflation receding, the negative correlation between bonds and equities has resurfaced and investors could benefit from this diversification potential by capturing defensive IG credit.
Global fragmentation to deepen
As we approach 2025, uncertainty remains around trade, elections, inflation, economic growth and political influence. While inflation may or may not be completely vanquished, we should not underestimate the gradual – but sure – progress that has been made. The Euro Area inflation rate was 10% in November 2022, but two years later it is around 2%. Looking globally, some underlying components, like shelter (or rents) remain strong, but it seems that we are at the sticky last mile of inflation.
As central banks ease monetary policy at different pace and magnitude, there will be more global fragmentation as we proceed through 2025, exacerbated by trade frictions. We expect divergence to increase particularly between Europe and the US given differing growth dynamics. Even within the Euro Area, there is a deepening divergence between countries with the peripheral economies (except for Italy) expected to lead growth in 2025 and the core of Austria, France and Germany at the bottom of the table1. In fact, French 10-year government bonds yields rose above the Greek equivalent bonds for the first time in history recently amid concerns around tackling France’s deficit, which was followed by a no-confidence vote to oust Prime Minister Barnier and his budget. Germany’s manufacturing woes and the political upheaval in France cloud their outlook, while some peripheral countries, such as Portugal, are expected to outpace even the US growth trajectory1.
A higher fiscal impulse from the Trump presidency could boost US growth. Conversely, tariffs could reignite inflation and dampen growth, risking spillover effects for the rest of the world. US exceptionalism looks set to continue for the year ahead. Such economic conditions explain the additional risk premium for Euro versus US investment grade (IG) credit. While spreads are tight (almost universally) relative to long-term history, better value can be uncovered in Europe. Political uncertainty and risk sentiment around growth outcomes is likely to keep driving bond pricing dislocations in 2025.
Low growth, bad for bonds?
Over time, the best predictor for bond market returns is the starting level of yields (the yield at which you first buy a bond). Given recent inflation shocks, and with budget deficits unlikely to be sustainable over the longer term, it is right for bond investors to focus on downside risks. However, the thesis that bond vigilantes will cause sharp market sell-offs as they attack “Trussonomic” (loose) policies is not easily reconciled with lacklustre global GDP growth expectations – typically a good environment to harvest the yield on fixed income investments.
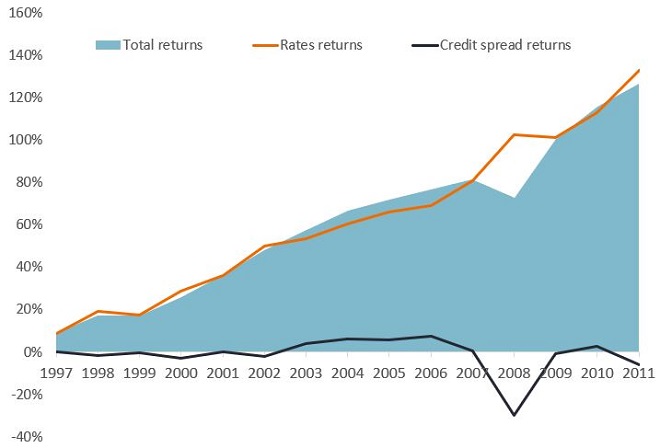
Pre-Global Financial Crisis (GFC), most of the total returns from IG credit were dominated by the risk-free rate, supplemented by a bit of spread (equating to the yield) and the two components would offset each other. This is shown by Figure 1, where interest rates dominate returns in this period. When there was spread volatility, overall yields would compensate, supported by the underlying risk-free rate. Higher rates therefore can help dampen volatility in performance. With yields now back to pre-GFC levels, this is a positive environment for total returns, as seen in the early 2000s when credit spreads did not contribute much to total returns – but total returns were still strong (Figure 1).
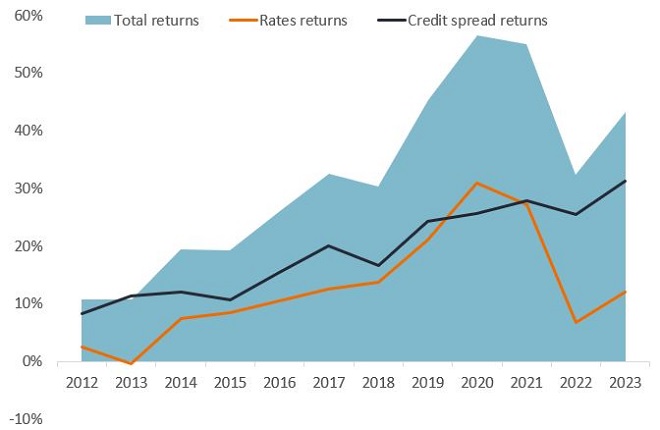
Following the GFC, central banks heralded a wave of financial repression, stimulating their economies through quantitative easing or bond purchases. The starting point for yields in this decade did not bode well for future returns and when credit spreads widened, the underlying risk-free rate was not sufficient to compensate for falling prices. With little yield available to harvest, credit spreads needed to do the heavy lifting to generate positive returns (Figure 2). Post Covid, with central banks laser focused on keeping inflation in check, the yield cushion2 has returned.
Figure 1: Pre-financial repression before/ during the GFC – rates drove total returns

Source: Janus Henderson investors return analysis based on the ICE BofA Global Corporate Index. Spreads are government option-adjusted spreads, 30 November 2024.
Past performance does not predict future returns.
Figure 2: Post-financial repression after the GFC – spreads drove total returns

Source: Janus Henderson investors return analysis based on the ICE BofA Global Corporate Index. Spreads are government option-adjusted spreads, 30 November 2024. Past performance does not predict future returns.
Bond diversification is back
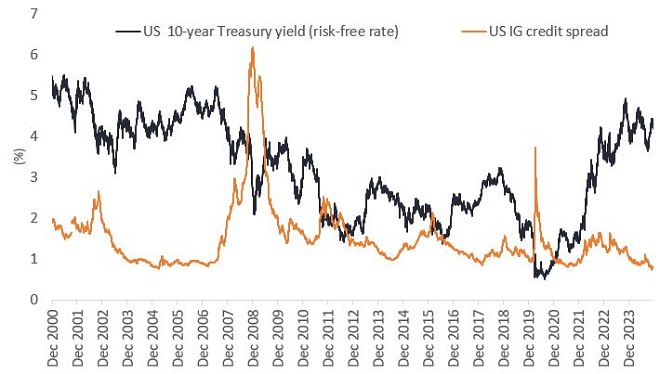
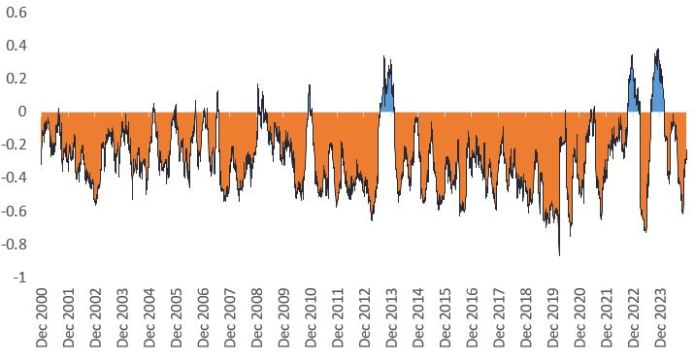
Asset allocators therefore stand to benefit from the diversification potential of bonds, as the negative correlation between bond spreads and interest rates has returned (Figure 3). When we analyse this relationship over time, positive correlation has only occurred during periods of an indiscriminate major cross-asset rally or sell-off (Figure 4). In Q4 2022 and Q4 2023, both equities and bonds rallied as fears of inflation receded. During the 2013 Taper Tantrum all assets weakened over fears about market liquidity until a new equilibrium emerged. The natural negative correlation between interest rates and bond spreads reasserts itself, which means investors can use a combination of risk-free assets (rates) and risky assets (credit spreads) – i.e. an IG bond – to improve diversification.
Figure 3: Rates (risk-free rate) and credit spreads tend to move in opposite directions

Figure 4: Negative correlation between rates and spreads is back

Source: Janus Henderson Investors, 2 December 2024. ICE BofA US Corporate Index Option-Adjusted Spread. Correlation in Figure 4 is the correlation between the two indices in Figure 3. Past performance does not predict future returns.
Is yield the saviour then?
Rising animal spirits3 have driven inflows into IG credit in 2024 and this implies spread risk will outperform rate risk. However, the perennial question for investors is whether there is scope for further spread tightening? During the pre-financial repression era, spreads got as low as 57bps in US IG in 19974. According to our model, US IG spreads are around 88bps5 when adjusting spreads for changes in index composition around quality and duration. Long-term returns in credit are principally driven by income, and this has been especially true over the past decade.
Despite rates coming down, overall yields remain attractive. For example, Euro IG yields are trading at the 77% percentile compared to the past decade. While we are in an easing cycle globally, rates are expected to remain relatively high compared to the last 20 years. Most corporates haven’t over-levered and fundamentals in IG have stayed resilient. Leverage (net debt to EBIDTA) levels for Euro and US IG non-financial corporations are much below Covid peaks and have started to trend down, while interest coverage ratios for these companies have recently ticked up6. Moreover, 75% of European non-financial corporate debt is borrowed via floating-rate bank loans7, which could help improve fundamentals as the European Central Bank cuts rates.
Nevertheless, we have seen volatility from mini cycles in sectors with highly leveraged asset-rich businesses, such as European real estate, US banks and UK utilities. Following the fallout from Covid and inventory woes, investors have struggled to value assets on balance sheets and extrapolate what ‘normal’ margins look like. Given rates are expected to remain high, active investors need to be cognisant of where the next pocket of concern could lie as idiosyncratic risk returns to bond markets.
Decline in dispersion
Given the broad spread compression in 2024, dispersion8 both between and within sectors has fallen. Strong demand for IG drove outperformance in the widest sectors9. In US credit, only three (media, cable & satellite and health insurance) out of 21 sectors are in the 50th percentile or higher in terms of issuer dispersion within the sector10. This implies that security selection will be key to returns in 2025.
As “a rising tide lifts all boats”, the ‘down in quality’ trade worked well in 2024, with the outperformance of CCC credits. However, the lack of differentiation here and within the BBB bucket is concerning. Given we expect more dispersion in 2025 as economies diverge, we are focused on finding better risk-adjusted valuations in the IG space and moving out the yield curve to capture returns without changing the beta of a portfolio. For example, defensive credits such as global multinationals based in Europe operating in areas of the economy that may not be that affected by slower growth, such as utilities, TMT (Technology, Media and Telecom) and consumer non-cyclicals. As discussed earlier, strong economic growth isn’t a prerequisite for attractive returns – as bond yields come down as interest rates are cut, they can generate capital gains.
Starting yields are therefore important to determining long-term returns. While credit spreads could widen, 2025 looks to be a positive total return environment overall for corporate bonds, particularly if there is a further improvement in inflation dynamics. With inflation receding, the negative correlation between bonds and risk assets has resurfaced. Investors could benefit from this diversification by capturing defensive IG credit.
Footnotes
1 Source: IMF, World Economic Outlook, October 2024.
2 Yield cushion, defined as a security’s yield divided by its duration, is a common approach that looks beyond yields as a cushion protecting bond investors from the potential negative effects of duration risk. The yield cushion potentially helps mitigate losses from falling bond prices if yields were to rise.
3 Animal spirits: A term coined by economist John Maynard Keynes to refer to the emotional factors that influence human behaviour, and the impact that this can have on markets and the economy. Often used to describe confidence or exuberance.
4 Source: Morgan Stanley. 26 November 2024. Spread adjusted for today’s rating mix.
5 Source: Janus Henderson Investors, 3 December 2024, according to the ICE BofA Global Corporate Index with duration adjusted to 6 years.
6 Source: FactSet, Goldman Sachs Global Investment Research, 4 October 2024.
7 Source: Morgan Stanley. 26 November 2024.
8 Dispersion describes the extent to which a distribution of datapoints is stretched or squeezed. If the datapoints cluster around certain values, then dispersion is low. If they are more spread out, then dispersion is high.
9 Source: BNP Paribas, 4 October 2024.
10 Source: Bloomberg, Barclays Research, 22 November 2024. Note: Range uses monthly data since 2010.
Glossary
10-Year Treasury Yield is the interest rate on U.S. Treasury bonds that will mature 10 years from the date of purchase.
Animal spirits: A term coined by economist John Maynard Keynes to refer to the emotional factors that influence human behaviour, and the impact that this can have on markets and the economy. Often used to describe confidence or exuberance.
Basis point (bp) equals 1/100 of a percentage point. 1 bp = 0.01%, 100 bps = 1%.
Balance sheets: A financial statement that summarises a company’s assets, liabilities and shareholders’ equity at a particular point in time. Each segment gives investors an idea as to what the company owns and owes, as well as the amount invested by shareholders. It is called a balance sheet because of the accounting equation: assets = liabilities + shareholders’ equity.
Bond vigilantes: A bond vigilante is a bond market investor who protests against monetary or fiscal policies considered inflationary by selling bonds, thus increasing yields.
Budget deficit: A budget deficit occurs when a government spends more than it receives in revenue, such as taxes and other receipts. To cover the difference, the government borrows money, which is known as “public sector net borrowing” or the deficit.
Correlation: How far the price movements of two variables (eg. equity or fund returns) move in relation to each other. A correlation of +1.0 means that both variables have a strong association in the direction they move. If they have a correlation of -1.0, they move in opposite directions. A figure near zero suggests a weak or non-existent relationship between the two variables.
Corporate bond: A bond issued by a company. Bonds offer a return to investors in the form of periodic payments and the eventual return of the original money invested at issue on the maturity date.
Corporate fundamentals: Company fundamentals are the quantitative and qualitative information that reflects a company’s financial and economic position. Fundamental analysis is the process of using this information to evaluate a company’s growth potential, profitability, and financial health.
Credit: Credit is typically defined as an agreement between a lender and a borrower. It is often narrowly used to describe corporate borrowings, which can take the form of corporate bonds, loans or other fixed interest asset classes.
Credit spreads: The difference in yield between securities with similar maturity but different credit quality, often used to describe the difference in yield between corporate bonds and government bonds. Widening spreads generally indicate a deteriorating creditworthiness of corporate borrowers, while narrowing indicate improving.
Cyclical stocks: Companies that sell discretionary consumer items (such as cars), or industries highly sensitive to changes in the economy (eg. mining).
Dispersion describes the extent to which a distribution of datapoints is stretched or squeezed. If the datapoints cluster around certain values, then dispersion is low. If they are more spread out, then dispersion is high.
Diversification: A way of spreading risk by mixing different types of assets/asset classes in a portfolio, on the assumption that these assets will behave differently in any given scenario. Assets with low correlation should provide the most diversification.
Duration: Duration can measure how long it takes, in years, for an investor to be repaid a bond’s price by the bond’s total cash flows. Duration can also measure the sensitivity of a bond’s or fixed income portfolio’s price to changes in interest rates. The longer a bond’s duration, the higher its sensitivity to changes in interest rates and vice versa. ‘Going short duration’ refers to reducing the average duration of a portfolio, while ‘going long duration’ refers to extending a portfolio’s average duration.
Economic fragmentation: Economic fragmentation is a policy-driven reversal of global economic integration. It can be caused by strategic considerations like national security, economic security, or a desire to reduce reliance on other countries.
Financial repression: Financial repression refers to government policies that result in artificially low interest rates or reduced returns on investments, often to reduce government debt costs. These policies include controlling interest rates, imposing capital controls, and requiring institutions to hold government debt. Essentially, it’s a strategy to channel funds to the government at the expense of savers and investors.
Fiscal impulse: Fiscal impulse is a measure of the impact of a government’s fiscal policy on the economy over the business cycle.
Floating rate: A floating interest rate refers to a variable interest rate that changes over the duration of the debt obligation. It is usually tied to a benchmark rate such as the U.S. prime rate or SOFR.
Gross domestic product (GDP): The value of all finished goods and services produced by a country, within a specific time period (usually quarterly or annually). When GDP is increasing, people are spending more, and businesses may be expanding, and vice versa. GDP is a broad measure of the size and health of a country’s economy and can be used to compare different economies.
Idiosyncratic risk: Factors that are specific to a particular company and have little or no correlation with market risk.
Inflation: The rate at which the prices of goods and services are rising in an economy. The Consumer Price Index (CPI) and Retail Price Index (RPI) are two common measures. The opposite of deflation.
Interest coverage ratio: The interest coverage ratio measures how well a firm can pay the interest due on outstanding debt. The ratio is found by dividing a company’s earnings before interest and taxes (EBIT) by its interest expense during a given period.
Investment grade: A bond typically issued by governments or companies perceived to have a relatively low risk of defaulting on their payments, reflected in the higher rating given to them by credit ratings agencies.
Leverage: Leverage is also an interchangeable term for gearing: the ratio of a company’s loan capital (debt) to the value of its ordinary shares (equity); it can also be expressed in other ways such as net debt as a multiple of earnings, typically net debt/EBITDA (earnings before interest, tax, depreciation and amortisation). Higher leverage equates to higher debt levels.
Monetary policy: The policies of a central bank, aimed at influencing the level of inflation and growth in an economy. Monetary policy tools include setting interest rates and controlling the supply of money. Monetary stimulus refers to a central bank increasing the supply of money and lowering borrowing costs. Monetary tightening refers to central bank activity aimed at curbing inflation and slowing down growth in the economy by raising interest rates and reducing the supply of money.
Quantitative easing: An unconventional monetary policy used by central banks to stimulate the economy by boosting the amount of overall money in the banking system.
Risk-free rate: The rate of return of an investment with, theoretically, zero risk. The benchmark for the risk-free rate varies between countries. In the US, for example, the yield on a three-month US Treasury bill (a short-term money market instrument) is often used.
Risk premium: The additional return an investment is expected to provide in excess of the risk-free rate. The riskier an asset is deemed to be, the higher its risk premium, to compensate investors for the additional risk.
Spread compression: This occurs when the yield differences between Treasuries and other bonds with the same maturity decrease. This can be beneficial for corporate bonds, emerging markets, and high-yield bank loans.
Taper Tantrum: The taper tantrum was a financial event that occurred in 2013 when the Federal Reserve announced plans to reduce its bond purchases. The announcement caused a sharp sell-off in bond markets (sharp increase in yields) and a surge in volatility across various asset classes. It ended in September 2013.
Total return: Total return is the amount of value an investor earns from a security over a specific period, typically one year when all distributions are reinvested.
Yield: The level of income on a security over a set period, typically expressed as a percentage rate. For a bond, this is calculated as the coupon payment divided by the current bond price. A bond’s yield to maturity (YTM) is the yield on a benchmark security, such as a Treasury security, plus a spread above the risk-free rate. The spread compensates investors for the added risk of the bond.
Yield curve plots the yields (interest rate) of bonds with equal credit quality but differing maturity dates. Typically bonds with longer maturities have higher yields.
These are the views of the author at the time of publication and may differ from the views of other individuals/teams at Janus Henderson Investors. References made to individual securities do not constitute a recommendation to buy, sell or hold any security, investment strategy or market sector, and should not be assumed to be profitable. Janus Henderson Investors, its affiliated advisor, or its employees, may have a position in the securities mentioned.
Past performance does not predict future returns. The value of an investment and the income from it can fall as well as rise and you may not get back the amount originally invested.
The information in this article does not qualify as an investment recommendation.
There is no guarantee that past trends will continue, or forecasts will be realised.
Marketing Communication.


