Dispelling the myths around the European securitised market
Following the GFC, complex, risky and illiquid are labels that some investors associate with securitised debt. Head of Secured Credit Colin Fleury deconstructs these myths surrounding the asset class.

11 minute read
Key takeaways:
- The role that securitised assets played in the Global Financial Crisis (GFC) tarnished the reputation of the asset class, perpetuating a belief that all securitised is complex, risky and illiquid.
- Significant structural change seen since the GFC has brought confidence back into the securitised market, while broadening investor participation has helped boost liquidity and market stability.
- The European securitised market today is both robust and diverse, and can support the resilience of portfolio performance during periods of market stress and over longer time horizons.
Background – a GFC problem
Banks issued the first European securitisations in the late 1980s, as a funding tool to free up capital and transfer credit risk off their balance sheets. The market then experienced significant growth in the run up to the 2007/08 global financial crisis (GFC), with total placed outstanding European securitised debt reaching about €1 trillion in 2010[1]. Since the crisis, annual European supply has hovered broadly around €100bn, with issuance down markedly from pre-GFC levels. However, this has recently begun ticking up, with European primary issuance doubling to almost €104bn in the first half of 2024 compared to the same period in 2023.[2]
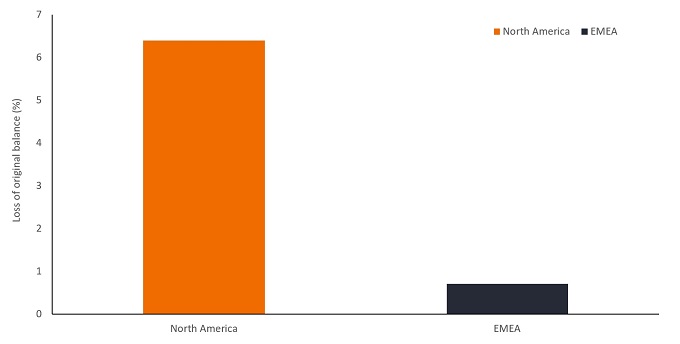
There’s no denying that the perception of securitised has been tainted by the performance of US residential mortgage-backed securitisations (RMBS) through the GFC. Back then, strong investor demand and overly optimistic collateral default expectations – backed by credit ratings agencies – fuelled unsustainable lending practices. A lack of appropriate checks and balances, particularly around some US sub-prime borrowers, resulted in large capital losses which spiralled upward through securitised structures. This was particularly the case for collateralised debt obligations (“CDOs”) – securitisations of certain financial assets – that purchased higher risk debt tranches of US mortgage securitisations, leveraging their risk to the US housing collapse that occurred. By contrast, European securitised performed significantly better, showing more resilience than US counterparts throughout the GFC.
Figure 1: European securitised fared better than North American counterparts through the GFC

Source: Fitch Ratings, February 2021. Losses shown are those of the 2000-2008 vintages. Losses in the charts include both losses realised and still expected to be realised at the time of the report.
A reformed sector
Since the GFC, the industry has gone through significant structural change. There has been widespread focus placed on the risk management practices of investors, tightening of asset origination criteria, stronger transparency requirements, and tightening of rating agency standards, returning confidence to the market and increased its robustness.
Since 2019, the implementation of the European Securitisation Regulation (SECR) has further tightened requirements around the asset class. For example, originators are now required to have “skin in the game”, retaining at least a 5% stake of a securitised assets’ net economic interest to guard against the type of moral hazard seen in the lead-up to the GFC.
Complex or simple?
A lack of transparency and complexity have been arguments used to stigmatise securitised products. The SECR regulation established clear guidelines requiring the production of loan level data in standardised formats, with full disclosure of data required. It also introduced a voluntary “Simple, Transparent, Standardised” label for securitisations,[3] where issuance of these high-quality straightforward structures has grown over the last few years.[4] As a consequence, there has been increased standardisation and transparency in structures.
While securitisation does involve an additional layer of complexity for non-experts, we think that with some education, most investors will find the process and structures quite straightforward. Simply put, while corporate bonds provide access to a single loan and single borrower, securitisation gives investors access to a pool of loans and borrowers. Securities are divided into classes – or tranches – and ranked according to their credit quality by a securitisation manager. Investors can then purchase securities in the tranche that suits their risk preference.
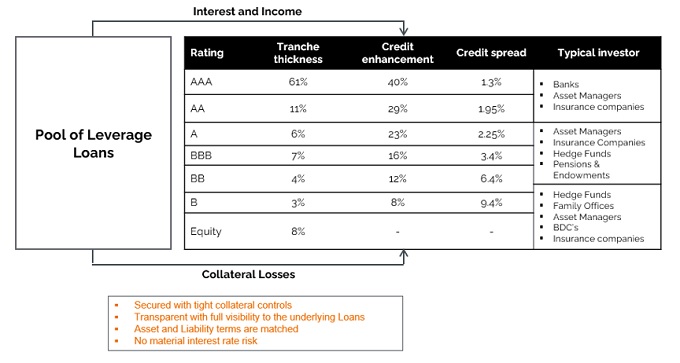
In some respects, securitisations are easier to understand than the complexities of corporate strategy and governance. Our philosophy is in making a complex asset class simple. For example, a collateralised loan obligation (“CLO”) – a portfolio of corporate loans that have been securitised – can be thought of as analogous to a mini bank (as an aggregator of loans), but with several key advantages:
- Investors have visibility of every loan that sits in the CLO collateral pool, which is not the case with bank loan books.
- When banks run into trouble, it’s often due to a lack of access to funding, whereas with securitisations, asset and liability terms are matched.
- Whilst there’s often ambiguity in the impact of interest rate moves on bank’s assets and liabilities, securitisation structures don’t take material interest rate risks.
Figure 2: Typical CLO structure – like a “mini bank” but with tight structuring

Source: Janus Henderson estimates 31 August 2024, structure and spreads representative of a typical European CLO new issue. Credit enhancement includes a conservative estimate of excess spread. Excess spread is where the interest earned on collateral pool exceeds the coupon payable on the securities. BDC = Business Development Company. For illustrative purposes only.
Risky or resilient?
Firstly, it is worth noting that even in North America aggregate losses across the securitisation market during the GFC were around 6% (Figure 1 earlier) – clearly far higher than expectation, but in our view the issue was more where some of the losses were concentrated and the overall scale of the market. Credit enhancement included in securitisations offer support to high-rated debt tranches and provide substantial coverage for extreme levels of collateral losses. For a AAA CLO, for example, the typical credit support is 40% – that is, until cumulative collateral losses exceed 40%, the AAA notes do not take a capital loss. This is five times greater than the worst collateral losses seen in the asset class (Figure 3). In fact, no European AAA, AA and A-rated CLO tranche has ever defaulted.[5]
Figure 3: Illustrative credit support levels versus historical losses on underlying collateral across securitised sectors
| Typical credit support | Worst historically observed losses* |
Credit support multiple for historical losses | |
| Prime RMBS AAA | 13% | 1% | 13.0x |
| Non-Prime RMBS AAA | 20% | 4% | 5.0x |
| Non-Prime RMBS AA | 16% | 4% | 4.0x |
| Non-Prime RMBS A | 11% | 4% | 2.8x |
| Near Prime Auto ABS AAA | 28% | 5% | 5.6x |
| CLO AAA | 40% | 8% | 5.0x |
| CLO AA | 29% | 8% | 3.6x |
| CLO A | 23% | 8% | 2.9x |
| CLO BBB | 16% | 8% | 2.0x |
| CLO BB | 12% | 8% | 1.5x |
Source: Janus Henderson Investors, Moody’s, selected individual transactions from investor presentations, as at 31 December 2023. Past performance does not predict future returns.
Note: *Worst historically observed losses: CLOs – based on worst 5-year cumulative defaults for the period between 2007 and 2020, based on Moody’s speculative grade default data and recovery rate of 65%. Prime and non-conforming RMBS – based on cumulative losses for 2007–2019. Prime auto ABS – based on Moody’s 5-year cumulative loss data on deals up to 2013, Near prime auto – based on selected individual transactions worst vintage cumulative defaults and 40% recovery rate. Janus Henderson estimates for illustrative purposes only. Each transaction will be different and the above are the views of Janus Henderson’s securitised team and should not be construed as advice.
The above analysis suggests that realised capital losses during the GFC on a broadly diversified European securitised portfolio should have been low. Using a representative account, we estimate an equivalent crisis (in terms of loss rates) would result in 0.7% of cumulative losses[6] as shown in Figure 4. This represents a little over 40% of the 1.6% estimated cumulative losses for a typical investment grade corporate bond portfolio over this period.[7] While this example is just illustrative[8], it supports the general picture of structural robustness in European securitised. This is what we similarly observed having managed securitised portfolios through the GFC.
Figure 4: Diversified European securitised portfolio through a GFC-style crisis
| % Portfolio | Assumed Loss Rate | Implied Portfolio Loss | |
| Auto Loan ABS | 23.2% | 0.0% | 0.00% |
| Consumer ABS | 7.7% | 0.0% | 0.00% |
| Prime RMBS | 7.8% | 0.0% | 0.00% |
| Non-Conforming RMBS | 9.9% | 1.2% | 0.12% |
| Buy-to-Let RMBS | 2.0% | 0.0% | 0.00% |
| CMBS | 5.7% | 8.9% | 0.50% |
| CLO | 35.0% | 0.1% | 0.03% |
| Other ABS | 6.2% | 0.2% | 0.01% |
| Covered Bonds | 2.6% | 0.0% | 0.00% |
| 100.0% | 0.7% | 0.67% |
Source: Fitch, Moody’s, Janus Henderson estimates, 30 June 2024. Most of implied losses are from the CMBS allocation of the representative portfolio. We are highly selective in the types of CMBS we own, with most AAA- or AA-rated. It should be noted that Fitch Ratings saw cumulative losses of 2.2% across the type of CMBS we own, which would typically only impact the debt tranches rated below AAA and AA, however, we have opted to conservatively estimate some impact to our owned tranches. Past performance does not predict future returns.
Even when the macroeconomic environment is benign, what typically hurts corporates tends to relate to governance, such as poor management or fraud. Securitisations don’t face the same governance risks as corporates, as the nature of securitisations is that of tight collateral controls and visibility into underlying collateral.
Illiquid or liquid?
Another concern has been around liquidity, particularly at times of market stress. However, the market has changed dramatically since the GFC. Back then, investors were largely bank proprietary desks and highly leveraged structured investment vehicles. When the GFC hit these investors largely stopped buying and there were limited alternative investors to step in. At Janus Henderson, in Europe we have been investing in the securitised market since before the onset of the GFC and we have seen the investor base change. Today, investors in the market are broad and diverse ranging across institutional investors, bank treasuries, mutual funds, private equity, hedge funds and insurers.
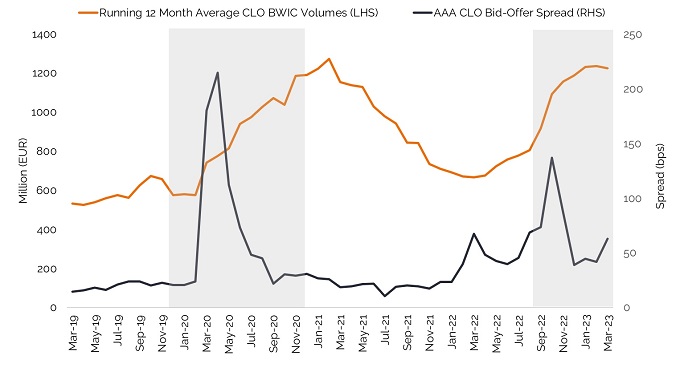
While the 2022 UK liability-driven investment (LDI) related turmoil resulted in a spike in trading volumes in European securitised, this was absorbed by a range of investors. With the issues driven by rising rates, pension schemes often looked first to sell down floating rate assets, such as securitised, to avoid crystallising larger capital losses in fixed rate bonds. Figure 5 focuses on trading seen in European CLOs. The subsequent dislocation in securitised prices saw the likes of bank treasuries and private equity firms purchase what remained fundamentally high-quality assets, but at attractive discounts. According to our estimates from market data, over €3 billion of CLOs were sold from September to November 2022 and volumes absorbed well, with over 80% trading to other investors in Europe.[9]
Similarly, following the outbreak of Covid-19, a natural widening in bid-offer spreads was matched by increased trading volumes. Within three months of this spread widening, AAA CLO bid-offer spreads were trading at their original levels, compared to European IG bonds taking a year to return to pre-crisis levels.[10]
Figure 5: Strong demand for CLOs through market volatility while prices quickly normalised

Source: Janus Henderson Investors and Deutsche Bank, March 2023. A measure of publicly reported trading volume in the market, “Bids Wanted in Competition” (or BWIC) are auction processes run by end investors to sell bonds. Past performance does not predict future returns.
Defensive, resilient and diverse
While the fallout from the GFC has somewhat tainted the reputation of the sector, the structural developments seen since – facilitated by regulation as well as independent change enacted by the industry – has revived interest in securitised and brought confidence back to the market. Assumptions that securitised is a complex, risky and illiquid asset class can be dismissed under closer examination.
We believe investors can benefit from its notable defensive qualities and help diversify portfolios away from traditional fixed income. Though it remains a specialist asset class, investors should take comfort that the common misconceptions surrounding European securitised are just that – misconceptions.
IMPORTANT INFORMATION
These are the views of the author at the time of publication and may differ from the views of other individuals/teams at Janus Henderson Investors. References made to individual securities do not constitute a recommendation to buy, sell or hold any security, investment strategy or market sector, and should not be assumed to be profitable. Janus Henderson Investors, its affiliated advisor, or its employees, may have a position in the securities mentioned.
There is no guarantee that past trends will continue, or forecasts will be realised. Past performance does not predict future returns.
The information in this article does not qualify as an investment recommendation. Marketing Communication.
[1] Source: AFME, Q1 2010.
[2] Placed issuance = €100bn. Source: AFME Securitisation Data Report Q4 2023 & 2023 Full Year, 28 March 2024. H1 issuance includes Australian debt denominated in Euros.
[3] Criteria on simplicity include requirements on homogeneity of the underlying exposures, underwriting standards and collateral credit quality. Standardisation requirements include early amortisation triggers, performance trigger-based reversion to sequential paydown, and “appropriate” mitigation of interest rate and currency risks. Transparency requirements include provision of a liability cash flow model and at least five years’ historical default and loss data for assets similar to the transaction’s underlying collateral. S&P Global. Meeting such criteria means the assets are eligible for preferential capital treatment.
[4] Source: AFME, as at the end of 2023.
[5] Source: Moody’s Investors Services, Janus Henderson Investors. Please note defaults and losses are for overall market, CLO transactions due to restrictive eligibility criteria typically experience lower default rates, 2023.
[6] Source: Janus Henderson Investors Analysis using data from Fitch (‘Structured Finance Losses: EMEA 2000-2018 Issuance’, 13 May 2019) usings the weights of a current portfolio (as at end June 2024) and analysis how performance would have fared during the GFC. Where data is not available, conservative estimates are used.
[7] Source: Janus Henderson Investors Analysis using Moody’s data of seven-year cumulative defaults of 2.7% for the 2007 cohort of global investment grade corporate bonds and average long-term recoveries for these senior unsecured bonds at around 40%.
[8] In reality, there would likely be variation in losses due to idiosyncratic credit events.
[9] Sources: Janus Henderson Investors and European CLO dealers.
[10] Source: Janus Henderson Investors, based on observed average daily dealer bid/offer spreads from CLO dealers, 2023.
These are the views of the author at the time of publication and may differ from the views of other individuals/teams at Janus Henderson Investors. References made to individual securities do not constitute a recommendation to buy, sell or hold any security, investment strategy or market sector, and should not be assumed to be profitable. Janus Henderson Investors, its affiliated advisor, or its employees, may have a position in the securities mentioned.
Past performance does not predict future returns. The value of an investment and the income from it can fall as well as rise and you may not get back the amount originally invested.
The information in this article does not qualify as an investment recommendation.
There is no guarantee that past trends will continue, or forecasts will be realised.
Marketing Communication.