
Key takeaways:
- Downward revisions to US jobs numbers corroborate the view we have held for some time that the non-farm payroll survey (the Establishment Survey) was creating a distorting impression of labour market strength in the US.
- Other surveys of hiring intentions and the Household Survey, which feeds the unemployment rate, have been much weaker than the non-farm payroll survey had suggested and remain so.
- Momentum in the Establishment Survey in aggregate is weaker and the sectoral breakdown shows the missing job losses in the manufacturing sector were perplexing by their absence given the weak level of manufacturing ISM.
“Some participants observed that, with the risks to the Committee’s dual-mandate goals having now come into better balance, labor market conditions would need careful monitoring.”
– Federal Reserve, Minutes of Meeting of June 11-12, 2024.
Over the last month the picture of the US employment market has shifted to one which indicates a worrying degree of cooling and has significant monetary policy implications for the US Federal Reserve (Fed).
As is normal at the early stages of a rise in the unemployment rate, a collapse in the hiring rate has been the driving factor for the rise in the unemployment rate from its 3.4% low to 4.3%.1 This is happening at a time when the targeted core PCE year-on-year inflation rate has dropped to 2.6%2 and headline CPI is expected to come in at 2.6% for August when the figure is released in a few weeks.
All to say, a central bank with a risk management framework will be increasingly focused on growth over inflation and is at risk of being behind the curve on rate cuts already. The September 6th jobs report has taken on out-sized importance as a result and, with a rate cut being signalled by the Fed, any further rise in the unemployment rate will put heavy pressure for a 50 basis points rate cut.
The information received has been in two parts:
FIRST
The August 2nd jobs report elicited a large reaction in fixed income markets due to a 0.2 percentage points rise in the unemployment rate and a weaker non-farm payrolls number. The non-farm payrolls (establishment survey) cooled to 114,000 and the household survey (which feeds into the unemployment rate) continued its run of very weak readings, i.e. a six month average of 19,000 jobs per month.3
The subsequent (August 16th) state level breakdown of the non-farm payrolls survey did nothing to clarify whether approx. 40,000 jobs were subtracted due to the impact of Hurricane Beryl in Texas. The reason for this is that Texas had lost 9,100 jobs in June before the 14,500 job losses in July and the breakdown of sectoral job losses in July were less from hurricane affected areas like leisure and hospitality and more from professional services.4
SECOND
The August 21st backward revisions to non-farm payrolls (the establishment survey). These are not official data yet but are estimates which await confirmation in February 2025. A historically significant downward revision of 818,000 jobs, only exceeded in 2009.5 This has changed the picture on the employment market in two ways:
- Momentum – the year-on-year growth rate of this survey now sits at 1.3% vs 1.9% prior. This pace of jobs growth is consistent with where previous recessions have started and is marginally below the soft landing of 1995/6 when jobs growth decelerated to 1.6%. However, this weaker pace of jobs growth was something we saw in the mid-2010s (Figure 1 below). In all, something worth monitoring but not yet flashing red.
Figure 1: Pace of US non-farm payrolls growth (% change year-on-year)

Source: Bloomberg, US non-farm payrolls, January 1950 to July 2024. There is no guarantee that past trends will continue, or forecasts will be realised.
- Sectoral picture – the revision down in manufacturing and construction jobs is now consistent with the employment lead indicators that we have followed and which remain at weak levels. The manufacturing sector now sees a job peak in early 2023 and job losses since then.
For some time, an employment lead indicator we follow (Figure 2) has illustrated that the US employment market (similar in many other developed economies) remains at risk of weakening.
Figure 2: US Employment Lead Index, year on year % change
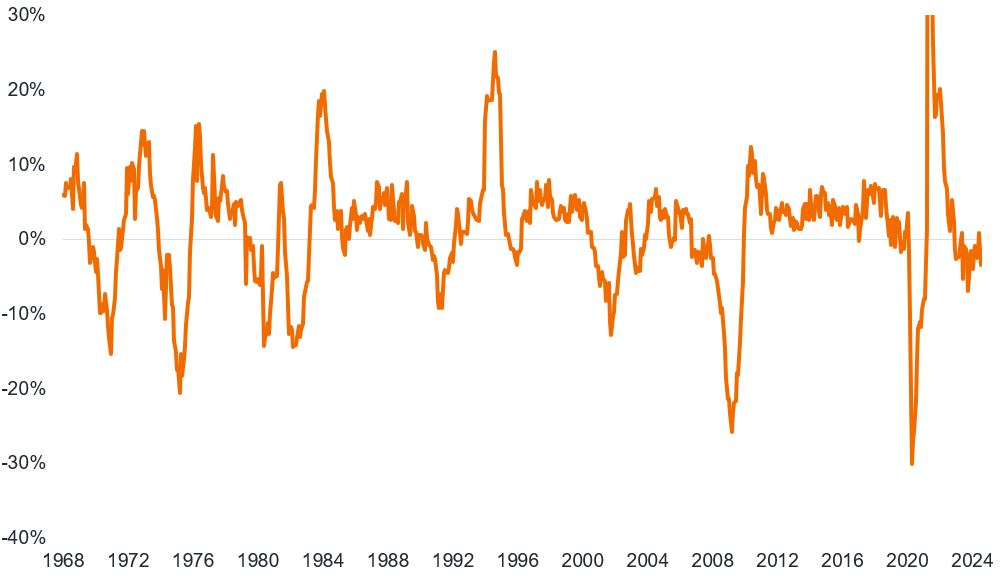
Source: Bloomberg, FRED, US Employment Lead Index, year-on-year % change, January 1968 to July 2024. There is no guarantee that past trends will continue, or forecasts will be realised.
We have also highlighted the collapse in the hiring rate to 2014 levels and the quits rate to 2018 levels. However, the missing piece has been the layoff rate which remains stuck at rock-bottom levels.6
The definition of a hard landing is a turn in the employment cycle and hence the risks remain and bear watching. This has been a very odd cycle in terms of business cycle lags, but it would be premature to signal the all-clear for the economy without a turn up in employment and other lead indicators.
1Source: Bureau of Labor Statistics, US unemployment rate at July 2024, recent low was April 2023.
2Source: Bureau of Economic Analysis, Personal Consumption Expenditures Price Index, excluding food and energy (Core PCE) at June 2024.
3Source: Bureau of Labor Statistics, Non-farm payrolls and household survey, July 2024 data.
4Source: Bureau of Labor Statistics, Texas Workforce Commission, Federal Reserve Bank of Dallas, June 2024 and July 2024 data.
5Source: Bureau of Labor Statistics, Non-farm payrolls revisions, revisions are done for month of March 2024, although they represent an annual revision, 21 August 2024.
6Source: Bureau of Labor Statistics, US Non-Farm Hires rate at June 2024, US Jobs Quits at June 2024, US Layoffs and Discharges rate (total non-farm) at June 2024.
Basis point (bp) equals 1/100 of a percentage point, 1bp = 0.01%
Business or economic cycle: Fluctuations in economic growth around a long-term growth rate. It explains the expansion and contraction in economic activity over time.
Core Personal Consumption Expenditure (PCE) Price Index is a measure of prices that people living in the US pay for goods and services, excluding food and energy. It is a measure of inflation.
Default: The failure of a debtor (such as a bond issuer) to pay interest or to return an original amount loaned when due.
Inflation: The rate at which prices of goods and services are rising in the economy. Core inflation typically excludes volatile items such as food and energy prices. A common measure for inflation is the Consumer Price Index (CPI).
Lead indicator: A lead indicator is a piece or set of economic data that can help provide an early signal of where we are in an economic cycle.
Monetary policy refers to the policies of a central bank, aimed at influencing the level of inflation and growth in an economy. It includes controlling interest rates and the supply of money.
Non-farm payrolls: The payrolls series that measures jobs in the US. The survey is conducted for the Bureau of Labor Statistics. A representative sample of businesses in the US provides data for the payroll survey (establishment survey), so it is a count of the number of jobs. The household survey in contrast is a representative survey of US households, which measures the status of workers, e.g. the number of people employed. The household survey has no duplication of individuals, because individuals are only counted once, even if they hold more than one job.
Purchasing Managers Indices (PMI) is a survey that acts as a leading insight into the prevailing direction of economic trends, based on the view of managers across different industries. The index is based on five indicators: new orders, inventory levels, production, supplier deliveries and the employment environment. The Institute for Supply Management (ISM) conducts a widely followed manufacturing PMI and Services PMI survey for the US.
Yield: The level of income on a security over a set period, typically expressed as a percentage rate. For a bond, at its most simple, this is calculated as the coupon payment divided by the current bond price.
IMPORTANT INFORMATION
Fixed income securities are subject to interest rate, inflation, credit and default risk. The bond market is volatile. As interest rates rise, bond prices usually fall, and vice versa. The return of principal is not guaranteed, and prices may decline if an issuer fails to make timely payments or its credit strength weakens.
There is no guarantee that past trends will continue, or forecasts will be realised
These are the views of the author at the time of publication and may differ from the views of other individuals/teams at Janus Henderson Investors. References made to individual securities do not constitute a recommendation to buy, sell or hold any security, investment strategy or market sector, and should not be assumed to be profitable. Janus Henderson Investors, its affiliated advisor, or its employees, may have a position in the securities mentioned.
Past performance does not predict future returns. The value of an investment and the income from it can fall as well as rise and you may not get back the amount originally invested.
The information in this article does not qualify as an investment recommendation.
There is no guarantee that past trends will continue, or forecasts will be realised.
Marketing Communication.