Do all roads lead to lower bond yields in 2024?
Jenna Barnard and John Pattullo, Co-Heads of Global Bonds, consider the outlook for bonds in 2024, positing that different routes are likely to lead to the same destination.

7 minute read
Key takeaways:
- The bond bear steepener in October 2023, which temporarily weighed on bond returns, appears to have signalled the peak in rates.
- How bond yields respond post the peak in rates could follow two historical routes but both are likely to lead to the same destination – lower bond yields.
- This sets up potentially strong returns from rate sensitive areas such as government bonds but economic weakness will necessitate care in corporate credit selection.
2023 was supposed to be the year of the bond – and while returns have been positive, broadly reflecting income from the bonds, a strong capital uplift from a decline in yields was less forthcoming. So, with interest rates arguably peaking, what caused the delay and where do yields go from here?
A bump in the road
Back in early October 2023 we discussed the phenomenon of a ‘bond bear steepener’ that was taking place. This is where yields on longer term bonds rise more than the rise on shorter dated bonds. It is called a steepener because the yield curve that plots yields of bonds of the same quality but different time to maturity is normally upward-sloping from bottom-left to top-right. So, if yields on longer dated bonds rise faster than on shorter dated bonds this would cause the yield curve to steepen. We explained that a bond bear steepener was a very rare occurrence and when it took place when yield curves were inverted – as was the case in 2023 – it typically led to 1) a fall from peak yields and 2) the onset of a recession.
As if on cue, yields began to fall throughout November and December, undoing much of the rise in yields during 2023, but not far enough to deliver the capital gains we had expected. But that was 2023. Can yields decline further in 2024 and will the second part of the historical pattern hold, i.e. will a recession take place?
Different route, same destination
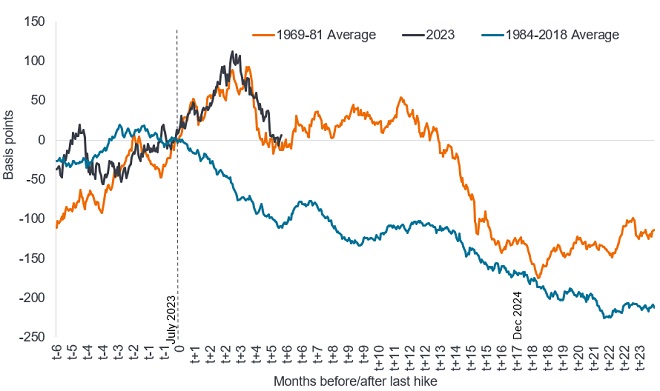
History may offer a valuable lesson. First, let’s agree that the July 2023 hike by the US Federal Reserve (Fed) was the final hike (or terminal rate in central bank parlance) in the current rate cycle. This seems a reasonable assumption given the remarkable pace of core disinflation now evident. We can then plot the change in the US 10-year Treasury yield before and after the last hike (as shown in Figure 1), with 0 representing the point of the last hike.
Recall that a rise in yields leads to a fall in bond prices and vice versa, so a declining line would indicate falling yields and rising bond prices. We compare this with how yields responded on average every time the Fed finished hiking rates in the 1969-81 period (characterised by rising and high inflation) and the 1984-2018 period (characterised by declining or low inflation). Overlaying the most recent 2023 episode shows that yields have followed the 1969-81 behaviour rather than 1984-2018 average.
Figure 1: Change in US 10-year Treasury yield after last rate hike

Source: Bloomberg, Janus Henderson calculations, 31 December 2023. Basis point (bp) equals 1/100 of a percentage point, 1bp = 0.01%. Past performance does not predict future returns.
This is interesting because it sets up potentially strong returns for bonds over the next 12-18 months regardless of which path is followed. Yet the outcome over the next six months or so could be very different:
- Frustrating near-term bond bear market: Yields follow the orange 1969-81 path. This would see them range bound for a significant part of 2024 – anything that reignites inflationary concerns or a temporary re-acceleration of growth that leads to central banks pushing back rate cuts might cause this. The longer spell of high interest rates tightens financial conditions and the economy weakens in the second half of 2024, inflation fears subside and rate cuts loom large, prompting a sharp decline in bond yields later in 2024.
- Steady bond bull market: Yields reconnect with the blue 1984-2018 path and bond yields steadily decline. This could happen if it becomes clear that inflation is firmly defeated. Central banks embark on rate cuts to prevent real rates (interest rates minus the inflation rate) becoming too restrictive.
Of course, bond yields may take an entirely new path that resembles neither of the above. While that may be the case, we reckon the general direction for yields in 2024 is lower. In our view, it seems unfeasible that the lags from earlier monetary tightening do not weigh on economic growth. We still see a high probability of a US downturn in 2024 and some European countries are already flirting with recession. Remember that even if central banks start the process of cutting rates, most companies or households that are refinancing debt or mortgages will be paying a higher rate of interest than was the case a few years ago. Policy will still be restrictive and if inflation is lower it means real (adjusted for inflation) rates are more punitive.
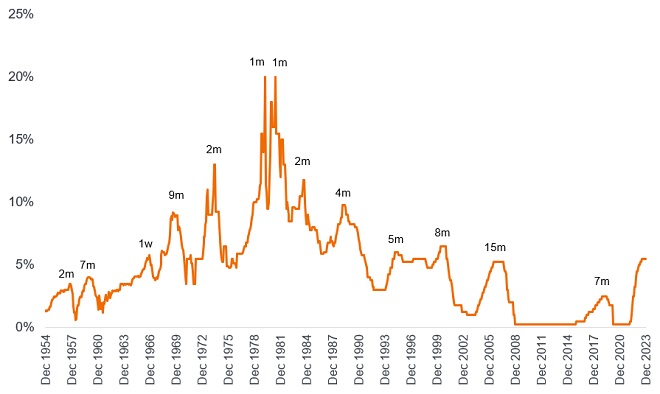
That is why when the Fed starts to cut, it tends to do so quickly. Interest rates rarely plateau for long. In fact, over the last 70 years the average plateau was six months. So, were a cut to occur in March 2024 – a plateau of eight months since the July 2023 hike – this would be broadly in line with the average cycle.
Figure 2: Rate peaks are typically short-lived and cuts proceed quickly
Federal Funds rate

Source: Janus Henderson, Piper Sandler, December 1954 to 31 December 2023. Fed funds rate reflects either effective rate or upper bound of target rate. m = month, w = week. Past performance does not predict future returns.
Synchronised easing
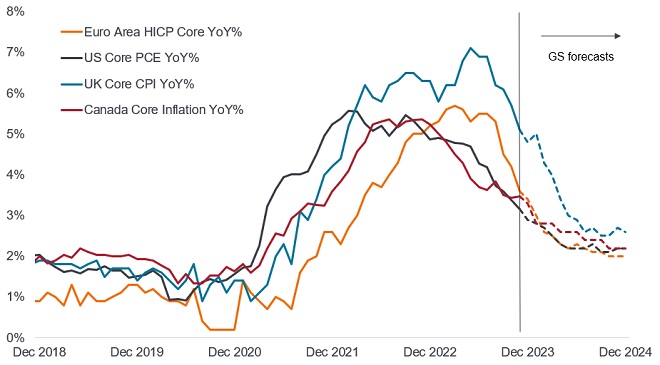
The hiking cycle among developed market central banks was synchronised, with most banks raising interest rates within a few months of each other. We expect the same to happen with cuts. We therefore think that 2024 should potentially offer the returns we expected in 2023, with a combination of income and capital gain from government bonds as yields decline.
Figure 3: What goes up must come down (together)
Inflation rates in key developed markets, year-on-year % change

Source: Janus Henderson Investors, Goldman Sachs forecasts, December 2018 to November 2023. HICP = Harmonised Index of Consumer Prices, PCE = Personal Consumption Expenditure, CPI = Consumer Price Index. Core represents inflation rates excluding volatile sectors such as food and energy. Dotted lines represent forecasts. There is no guarantee that past trends will continue, or forecasts will be realised.
Within credit, we believe that agency mortgage-backed securities potentially offer attractions, both for their income and their relatively low credit risk in being backed by federal agencies or the US government directly. We are also starting to view BB-rated high yield corporate bonds as almost a distinct asset class – it is becoming a repository for growth companies with improving cash flows, while several BBB-rated investment grade bonds, particularly among telecoms, are legacy companies saddled with high debt. Economic weakness means greater care may need to be taken when selecting among corporate credits.
In summary, the next few months could see bond yields taking different paths, but we ultimately expect a combination of income and declining rates to lead to attractive returns from bonds in 2024.
10-Year Treasury Yield is the interest rate on U.S. Treasury bonds that will mature 10 years from the date of purchase.
Bear market/Bull market: A bear market A bear market is one in which the prices of securities are falling in a prolonged or significant manner. A bull market is one in which the prices of securities are rising, especially over a long time.
Cash flow: The net amount of cash and cash equivalents transferred in and out of a company.
Core Personal Consumption Expenditure (PCE) Price Index is a measure of prices that people living in the U.S. pay for goods and services, excluding food and energy.
Credit rating: A score given by a credit rating agency such as S&P Global Ratings, Moody’s and Fitch on the creditworthiness of a borrower. For example, S&P ranks investment grade bonds from the highest AAA down to BBB and high yields bonds from BB through B down to CCC in terms of declining quality and greater risk, i.e. CCC rated borrowers carry a greater risk of default.
Credit risk: The risk that a borrower will default on its contractual obligations to make the required interest payments or repay the loan.
Disinflation: A fall in the rate of inflation.
Fannie Mae, Freddie Mac and Ginnie Mae are all US government-sponsored mortgage companies. Fannie Mae and Freddie Mac buy mortgages, pool them into mortgage-backed securities (MBS) and sell them to private investors. This secondary mortgage market increases the supply of funding available for mortgage lending. Ginnie Mae is a wholly owned government corporation which guarantees the timely payment of principal and interest payments on residential MBS. It does not purchase, sell or issue securities itself but institutions approved by Ginnie Mae can originate eligible loans and pool them into securities as Ginnie Mae MBS instruments.
High yield bond: Also known as a sub-investment grade bond, or ‘junk’ bond. These bonds usually carry a higher risk of the issuer defaulting on their payments, so they are typically issued with a higher interest rate (coupon) to compensate for the additional risk.
Inflation: The rate at which prices of goods and services are rising in the economy.
Investment-grade bond: A bond typically issued by governments or companies perceived to have a relatively low risk of defaulting on their payments, reflected in the higher rating given to them by credit ratings agencies.
Maturity: The maturity date of a bond is the date when the principal investment (and any final coupon) is paid to investors. Shorter-dated bonds generally mature within 5 years, medium-term bonds within 5 to 10 years, and longer-dated bonds after 10+ years.
Monetary Policy refers to the policies of a central bank, aimed at influencing the level of inflation and growth in an economy. It includes controlling interest rates and the supply of money. Monetary tightening refers to central bank activity aimed at curbing inflation and slowing down growth in the economy by raising interest rates and reducing the supply of money.
Mortgage-backed securities (MBS) may be more sensitive to interest rate changes. They are subject to extension risk, where borrowers extend the duration of their mortgages as interest rates rise, and prepayment risk, where borrowers pay off their mortgages earlier as interest rates fall. These risks may reduce returns.
The real interest rate is the rate of interest an investor, saver or lender receives after allowing for inflation.
Total return: This is the return on an asset or investment that takes into account both income and any capital gain/loss.
Yield: The level of income on a security over a set period, typically expressed as a percentage rate. For equities, a common measure is the dividend yield, which divides recent dividend payments for each share by the share price. For a bond, at its most simple, this is calculated as the coupon payment divided by the current bond price.
A yield curve plots the yields (interest rate) of bonds with equal credit quality but differing maturity dates. Typically bonds with longer maturities have higher yields. An inverted yield curve occurs when short-term yields are higher than long-term yields.
U.S. Treasury securities are direct debt obligations issued by the U.S. Government. The investor is a creditor of the government. Treasury Bills and U.S. Government Bonds are guaranteed by the full faith and credit of the U.S. government, are generally considered to be free of credit risk and typically carry lower yields than other securities.
Volatility measures risk using the dispersion of returns for a given investment. The rate and extent at which the price of a portfolio, security or index moves up and down.
IMPORTANT INFORMATION
Fixed income securities are subject to interest rate, inflation, credit and default risk. The bond market is volatile. As interest rates rise, bond prices usually fall, and vice versa. The return of principal is not guaranteed, and prices may decline if an issuer fails to make timely payments or its credit strength weakens.
High-yield or “junk” bonds involve a greater risk of default and price volatility and can experience sudden and sharp price swings.
Mortgage-backed securities (MBS) may be more sensitive to interest rate changes. They are subject to extension risk, where borrowers extend the duration of their mortgages as interest rates rise, and prepayment risk, where borrowers pay off their mortgages earlier as interest rates fall. These risks may reduce returns
These are the views of the author at the time of publication and may differ from the views of other individuals/teams at Janus Henderson Investors. References made to individual securities do not constitute a recommendation to buy, sell or hold any security, investment strategy or market sector, and should not be assumed to be profitable. Janus Henderson Investors, its affiliated advisor, or its employees, may have a position in the securities mentioned.
Past performance does not predict future returns. The value of an investment and the income from it can fall as well as rise and you may not get back the amount originally invested.
The information in this article does not qualify as an investment recommendation.
There is no guarantee that past trends will continue, or forecasts will be realised.
Marketing Communication.


