The Global Financial Crisis (GFC) period left a stigma overshadowing global securitised markets as being ‘complex’, ‘illiquid’ and ‘risky’. CLOs have not been immune from this perception by some. Looking at the structures of CLOs and how this influences their actual historical performance can dispel these myths and evidences their structural robustness in delivering attractive returns for diversified fixed income portfolios. As we have done in a previous series on the European securitised sector, we evaluate these myths in reference to AAA CLOs, as the highest-grade segment of the asset class that investors can access.
Complex?
CLOs analogous to a mini-bank
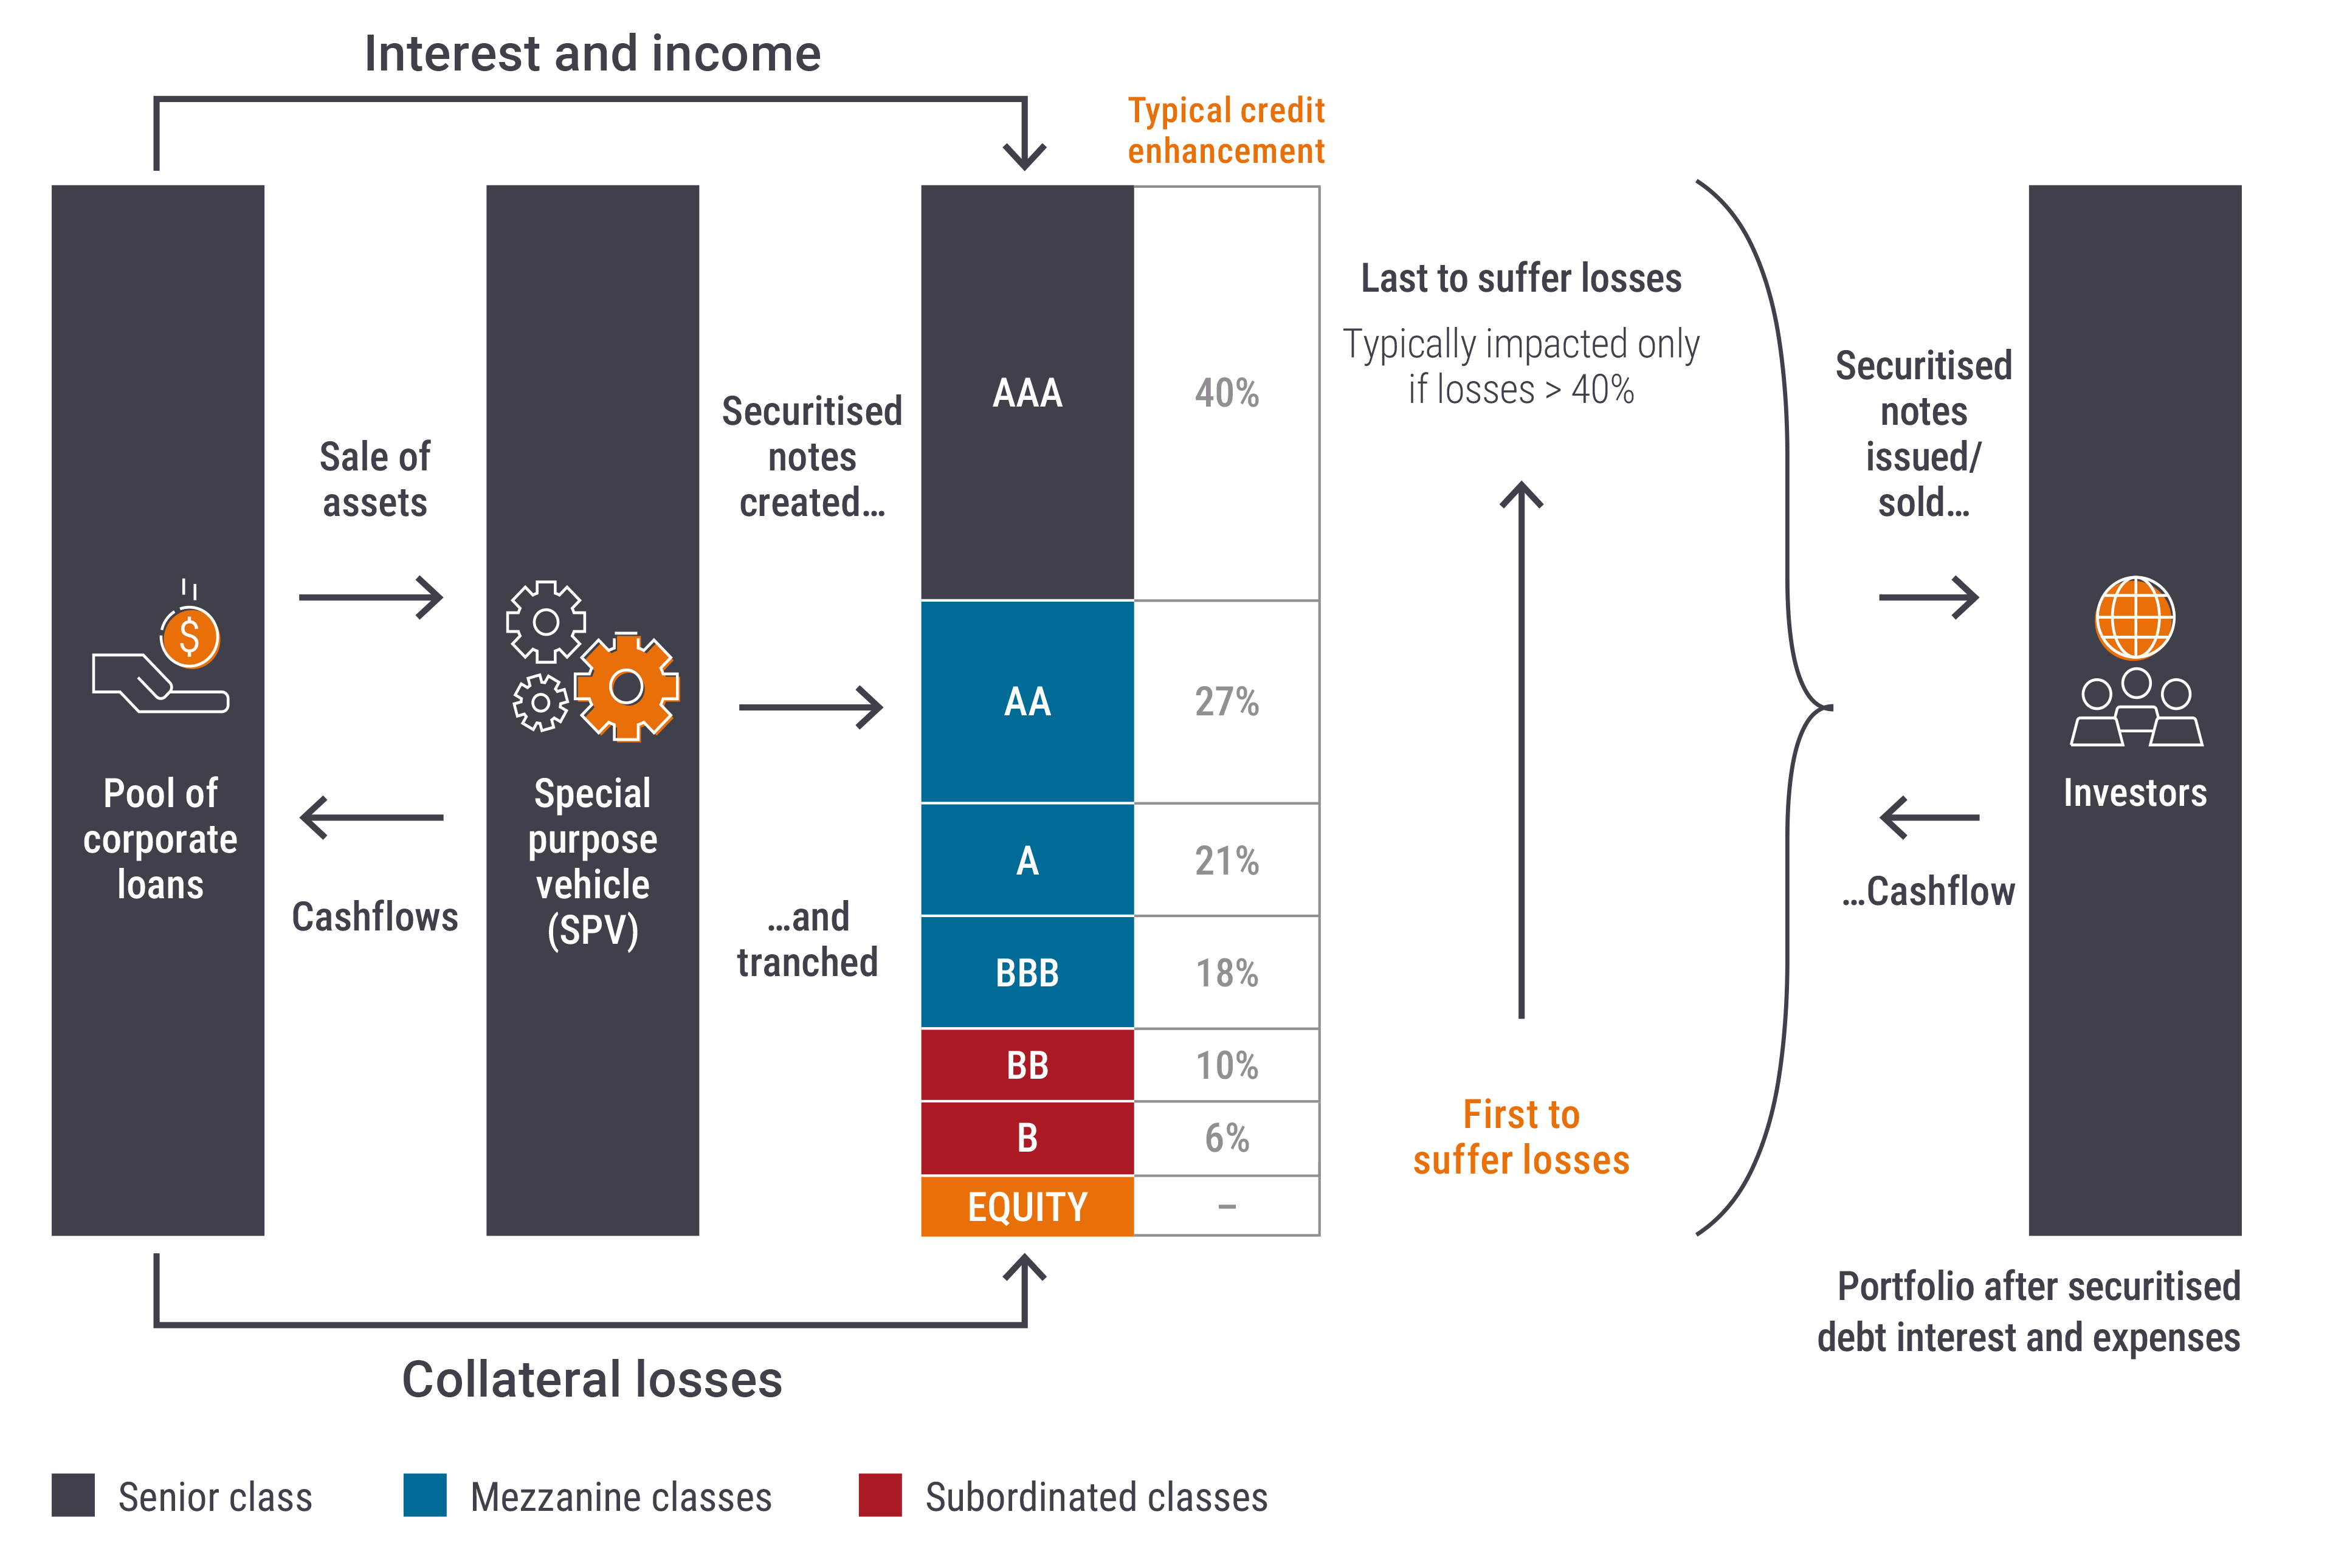
While securitisation does involve an additional layer of complexity for non-experts, we think that with some education, most investors can find the process and structures quite straightforward. Simply put, while corporate bonds provide access to a single loan and single borrower, securitisation gives investors access to a diversified pool of loans and borrowers. Experienced institutional managers, of which there are currently 67 in Europe[1], select, monitor the performance and manage the loans in a CLO. There are relatively standardised and tight controls over the type and diversity of loans that can be owned. Securities issued by a CLO are divided into classes – or tranches – and ranked according to their credit quality within a securitisation structure. Investors can then purchase securities in the tranche that suits their risk preference.
In some respects, securitisations are easier to understand than seeking to analyse the complexities of corporate strategy and governance. For example, a CLO – a portfolio of broadly syndicated corporate loans rated below investment grade (IG) that have been securitised – can be thought of as analogous to a mini bank (as an aggregator of loans), but with several key advantages:
- Investors have visibility of every loan that sits in the CLO collateral pool, which is not the case with bank loan books.
- When banks run into trouble, it is often due to a lack of access to funding, whereas with securitisations, asset and liability terms are matched.
- While there is often ambiguity about the impact of interest rate moves on bank’s assets and liabilities, securitisation structures don’t take material interest rate risks.
Figure 1: CLO structure uses credit enhancement to improve credit quality

Source: Janus Henderson Investors. For illustrative purposes only. Credit enhancement: Used in securitisation to improve the credit quality and ratings of the debt tranches. The percentages shown include a small amount of excess spread, which is the net income earned on the loan portfolio after payment of securitised debt interest and operational expenses. It is redirected from the equity holders if needed to help offset portfolio losses.
Should a loan default, any losses are allocated from the bottom of the CLO structure, starting with the equity. Each subsequent tranche provides protection against portfolio losses to more senior tranches of debt. Typically, portfolio losses need to be above 40% before the most senior bonds rated AAA start to be impacted (Figure 1). The loans owned by a CLO are also secured. While the type of security and recovery following default can vary, history shows that average recoveries have typically been more than 60%[2]. This suggests that all the loans in a typical CLO portfolio could default and the AAA notes still be fully repaid. While clearly illustrative, this shows the inherent structural protections (or credit enhancement) against loss within AAA CLOs.
In terms of high visibility into the underlying collateral, transparency has also improved with the introduction of the European Securitised Regulation (EUSR) in 2019, post the GFC. Clear guidelines have now been introduced on the production of loan level data in standardised formats. The EUSR is prescriptive on what information and the form in which it should be made available and dictates in detail which specific documents and data. It also requires that investors analyse information provided both prior to investment, and on an ongoing basis.
Underlying loans are similar to high yield
While the underlying loans within a CLO are often referred to as ‘leveraged’ this refers to the high yield (HY) or sub-investment grade quality of the borrower, rather than any actual leverage in a CLO structure. These are loans to large companies, with the companies typically having enterprise valuations in excess of EUR€1 billion and often many multiples of this. The companies that finance themselves through loans are generally no different from those companies that finance themselves through HY bonds. Indeed, in many instances individual companies will have issued both HY bonds and loans. Rather than esoteric companies, they are often household names that raise finance in both the loan and HY markets (Figure 2).
Figure 2: Example companies with loans in European CLOs
| Borrower name | Sector | European CLO holdings (%) | European high yield index (%) |
| Action | Retail | 1.0 | 0.0 |
| Ziggo | Media | 0.9 | 0.9 |
| Virgin Media | Media | 0.9 | 1.7 |
| Masorange | Telecom | 0.9 | 0.0 |
| Verisure | Security services | 0.9 | 1.3 |
| Ineos Quattro | Chemicals | 0.8 | 0.5 |
Source: Janus Henderson Investors, as at 20 December 2024.
Note: References made to individual securities do not constitute a recommendation to buy, sell or hold any security, investment strategy or market sector, and should not be assumed to be profitable. Janus Henderson Investors, its affiliated advisor, or its employees, may have a position in the securities mentioned. Use of third party names, marks or logos is purely for illustrative purposes and does not imply any association between any third party and Janus Henderson Investors, nor any endorsement or recommendation by or of any third party. Unless stated otherwise, trademarks are the exclusive property of their respective owners.
High Yield index refers to ICE BofA European Currency Non-Financial High Yield 2% Constrained Index. European CLO holdings source: IntexCalc.
Understanding the similarity between the underlying loans in CLOs and HY bonds can help investors already comfortable with HY to transition into investing in CLOs. The comparable size and issuer profile between the European leveraged loans market and the HY market indicate that CLOs offer a familiar yet distinct investment opportunity with the advantage of tailored risk exposure, such as AAA-rated debt.
Illiquid?
Given the GFC created misconceptions around securitised debt generally, tarnishing it as ‘illiquid’ and ‘risky’, some have viewed CLOs through this lens. However, the European CLO market itself is significant and liquid, sized at around 60% of the size of the European HY market[3]. In addition, a deeper dive into historical defaults and performance during volatile markets and quick recoveries challenges this. As an active investor in CLOs for more than 15 years, experience tells us that liquidity is also far better than many might perceive.
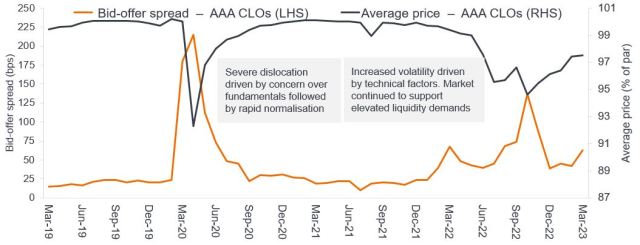
The 2022 Liability-Driven Investment (LDI) crisis[4] underscored this, when about EUR€3.3 billion of AAA CLOs[5] traded over a short time horizon. The real liquidity test, however, is the ability to raise funds efficiently without excessive costs. In October 2022, at the height of the LDI crisis, the average liquidity cost for AAA CLOs – the difference between the bid and offer on a specific bond or the bid-ask spread – was around 1.4%, against a backdrop of a 5% average cash price decline (Figure 3). So while both bid-ask spreads and prices felt the impact of absorbing these volumes, markets remained functional with rational pricing observed. Market conditions also quickly normalised after this. This evidences how ample liquidity, market transparency and minimal default risk for AAA CLOs can help facilitate swift recoveries.
Figure 3: Active CLO market during market volatility with rapid normalisation of cost of liquidity

Source: Janus Henderson Investors, JP Morgan, as at March 2023. There is no guarantee past trends will continue.
Risky?
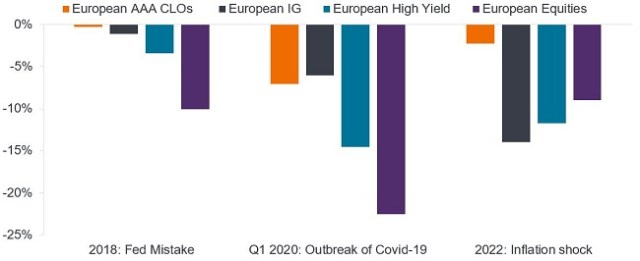
So while assumptions around the GFC may have left a stigma that securitised investments – including CLOs – are ‘risky’, this can be refuted when looking at their historical performance. During volatile markets, such as during the 2018 Fed hike mistake, Covid outbreak in Q1 2020 and rising rates of 2022, AAA CLOs delivered total returns equivalent to or better than IG credit (Figure 4). Drawdowns in AAA CLOs tend to be shorter and shallower than in such traditional corporate credit, as shown in Figure 5. AAA CLOs experienced minimal drawdowns during the 2018 rate event and a swift recovery post-COVID, against a slightly more prolonged recovery of IG credit. During 2022, the drawdown of AAA CLOs was shallower and recovery quicker, partly due to its floating rate nature, unlike the severe and lasting impacts on more rate-sensitive Euro IG, which has not yet recovered.
Figure 4: Minimal downside risk in AAA CLOs

Source: Janus Henderson Investors, JP Morgan, Citi, Bloomberg. EUR returns. European AAA CLOs: JP Morgan European AAA CLO Index. European IG: ICE BofA Euro Corporate Bond Index. European High Yield: ICE BofA European Currency Non-Financial High Yield 2% Constrained Ind. European Equities: MSCI Europe.
Note: The orange or black bars mark the drawdown point from the previous high watermark. When these bars disappear (reach zero), the asset class has retraced returns to that high watermark. 2018 and 2022 periods correspond to calendar year returns. For illustrative purposes only. Past performance does not predict future returns.
Figure 5: Shallow and brief drawdowns relative to traditional corporate credit
Source: Janus Henderson Investors, Bloomberg, JP Morgan as at 31 October 2024.
Note: Chart showing cumulative drawdowns. JPM AAA CLO Index: JP Morgan European AAA CLOIE index. European IG Index: ICE BofA Euro Corporate Bond Index. Drawdown returns from 31 December 2017 to 31 October 2024. Past performance does not predict future returns.
Even through the macro stresses of the GFC period there has never been a default of an A, AA, or AAA rated CLO debt tranche in Europe (and for that matter only a loss of 0.2% for A-rated CLOs in the US – refer to Figure 8). Figure 6 helps to illustrate why. It shows typical rankings of the various debt tranches in a European CLO. Against this, we have overlayed historic rolling sub-IG default rates and estimated cumulative losses (assuming a 60% recovery rate follows a loan default). The cumulative loss line peaks at nearly 16%, materially below the level needed to start to impact the value of a typical A-rated tranche.
Even in environments of high default rates, structural protections in CLOs – such as capturing excess spread when needed to absorb the impact of portfolio loan default losses and covenants (or triggers) that control principal cashflows – have helped to materially reduce losses to BBB and BB-rated tranches. With 40% credit enhancement to a typical AAA CLO, this would also imply losses of more than two and a half times the GFC peak level are needed in order to start to incur a potential loss on a AAA CLO.
Figure 6: Historical cumulative loan losses vs CLO tranche protection
Source: Credit Suisse/UBS, as at 31 October 2024: Loss rate calculated based on cumulative defaults and 60% recovery rate. Past performance does not predict future returns. For illustrative purposes only.
Figure 7 provides longer-term impairment (or default loss) rates for CLOs and supports their inherent resilience when compared with corporate bonds.
Figure 7: 10-year impairment rate by original rating (1993-2017)
| Tranche | Euro CLOs | US CLOs | Euro corporate |
| AAA | 0.0% | 0.0% | 0.1% |
| AA | 0.0% | 0.0% | 0.7% |
| A | 0.0% | 0.2% | 2.2% |
| BBB | 0.5% | 2.3% | 3.5% |
| BB | 5.3% | 4.2% | 15.7% |
Source: Moody’s Investors Services, as at 31 October 2024. Past performance does not predict future returns. For illustrative purposes only.
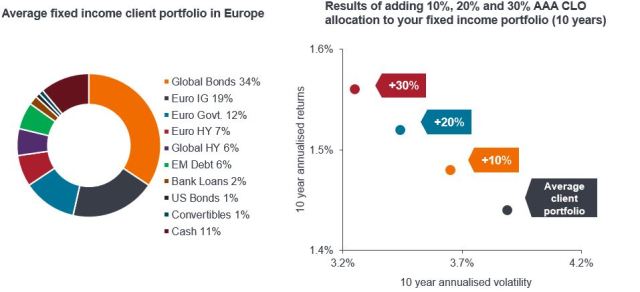
With this long-term lens in mind, AAA European CLOs arguably demonstrate superior risk-adjusted returns with lower volatility compared to traditional IG assets such as Euro IG. For those looking to build diversified fixed income portfolios, in our view, AAA CLOs present an efficient alternative, enhancing portfolio performance potential without added risk. We can see this when looking at research from our Portfolio Construction & Strategy Team, who have analysed the asset class make-up of a typical European client portfolio and how adding a 10%, 20%, 30% allocation of AAA CLOs improves the portfolio’s risk-return dynamics. As a manager of broadly diversified fixed income portfolios, this has certainly been our experience over many years.
Figure 8 & 9: Allocating to AAA CLOs can improve risk-adjusted returns

Source: Janus Henderson Investors, Bloomberg, Morningstar, JPMorgan. As at 30 November 2024. Indices used as representative in hypothetical portfolios: Global Bonds – Bloomberg Global Aggregate TR Hdg EUR; Euro IG – ICE BofA Euro Corporate TR EUR; Euro Govt.– Bloomberg Euro Agg GvtR TR EUR; Euro HY – Bloomberg Pan Euro HY TR EUR; Global HY – Bloomberg Global High Yield TR EUR; EM Debt – Bloomberg EM Hard Currency Agg TR USD; Bank Loans – Credit Suisse Western European Leveraged Loan TR Hdg EUR; US Bonds – Bloomberg US Agg Bond TR EUR; Convertibles – Refinitiv Europe CB TR EUR; Cash – ICE BofA EURCcy 3M Dep BdRt CM TR EUR (Cash). Average client portfolio is based on the average of Janus Henderson European clients’ fixed income portfolios. Portfolios are hypothetical and performance is based on historic index returns. Investors should not assume they will have a similar investment experience. Past performance does not predict future returns.
So we can now see that the misconceptions that CLOs are ‘complex’, ‘illiquid’ and ‘risky’ are ill-founded when assessing historical evidence. Given their ability to capture high-quality defensive carry, they can offer investors an efficient alternative to IG corporates to improve portfolio diversification. Investors can leverage the structural insights and data behind CLOs to make informed decisions, capitalising on their protective features and performance potential. Additionally, active management, such as monitoring the performance of CLO managers and the underlying loans and use of proprietary systems and leveraging standardised data post-EUSR, can further inform investment decisions. This ensures a strategic and risk-controlled approach to leveraging CLOs’ benefits in fixed income portfolio management.
Footnotes
[1] Source: Janus Henderson Investors, Bloomberg, Index Calc and JPMorgan Indices, as at 29 November 2024.
[2] Source: UBS, as at 31 December 2024.
[3] Source: Janus Henderson Investors, BofA Securities CLO Factbook, as at 10 November 2023. For illustrative purposes only.
[4] This crisis affected UK defined benefit pension schemes, which had to quickly sell assets to meet margin calls after the government “mini-budget” announcement caused a sharp increase in gilt yields.
[5] Source: Janus Henderson Investors and European CLO dealers, November 2023. Period covered 1 September 2022 to 30 November 2022.
These are the views of the author at the time of publication and may differ from the views of other individuals/teams at Janus Henderson Investors. References made to individual securities do not constitute a recommendation to buy, sell or hold any security, investment strategy or market sector, and should not be assumed to be profitable. Janus Henderson Investors, its affiliated advisor, or its employees, may have a position in the securities mentioned.
Past performance does not predict future returns. The value of an investment and the income from it can fall as well as rise and you may not get back the amount originally invested.
The information in this article does not qualify as an investment recommendation.
There is no guarantee that past trends will continue, or forecasts will be realised.
Marketing Communication.
Important information
Please read the following important information regarding funds related to this article.
- An issuer of a bond (or money market instrument) may become unable or unwilling to pay interest or repay capital to the Fund. If this happens or the market perceives this may happen, the value of the bond will fall.
- When interest rates rise (or fall), the prices of different securities will be affected differently. In particular, bond values generally fall when interest rates rise (or are expected to rise). This risk is typically greater the longer the maturity of a bond investment.
- The Fund invests in high yield (non-investment grade) bonds and while these generally offer higher rates of interest than investment grade bonds, they are more speculative and more sensitive to adverse changes in market conditions.
- Some bonds (callable bonds) allow their issuers the right to repay capital early or to extend the maturity. Issuers may exercise these rights when favourable to them and as a result the value of the Fund may be impacted.
- If a Fund has a high exposure to a particular country or geographical region it carries a higher level of risk than a Fund which is more broadly diversified.
- The Fund may use derivatives to help achieve its investment objective. This can result in leverage (higher levels of debt), which can magnify an investment outcome. Gains or losses to the Fund may therefore be greater than the cost of the derivative. Derivatives also introduce other risks, in particular, that a derivative counterparty may not meet its contractual obligations.
- When the Fund, or a share/unit class, seeks to mitigate exchange rate movements of a currency relative to the base currency (hedge), the hedging strategy itself may positively or negatively impact the value of the Fund due to differences in short-term interest rates between the currencies.
- Securities within the Fund could become hard to value or to sell at a desired time and price, especially in extreme market conditions when asset prices may be falling, increasing the risk of investment losses.
- The Fund may incur a higher level of transaction costs as a result of investing in less actively traded or less developed markets compared to a fund that invests in more active/developed markets.
- Some or all of the ongoing charges may be taken from capital, which may erode capital or reduce potential for capital growth.
- The Fund could lose money if a counterparty with which the Fund trades becomes unwilling or unable to meet its obligations, or as a result of failure or delay in operational processes or the failure of a third party provider.

