U.S. small caps: Is the tide turning?
After years of large-cap dominance, U.S. small-cap stocks are gaining ground. With economic conditions shifting and relative valuations at historical lows, Portfolio Managers Jonathan Coleman, CFA, and Justin Tugman, CFA, explain why we could be witnessing the early stages of a shift in market leadership toward small caps.

6 minute read
Key takeaways:
- Since early July, small-cap stocks have outperformed large caps, with performance spurred by expectations for a sooner-than-later start to the Federal Reserve’s (Fed) rate-cutting cycle.
- The combination of attractive relative valuations, the potential for improving cost of capital conditions, and the natural progression of market cycles suggests a more favorable period for small cap stocks ahead.
- Still, wide dispersion in both small-cap valuations and company fundamentals highlight the need for an active and selective approach to effectively navigate the asset class.
U.S. small-cap stocks are showing signs of renewed momentum, potentially signaling a shift in performance leadership. Since mid-July, the Russell 2000 Index has outpaced large-cap indices and the “Magnificent Seven” stocks (Figure 1). This resurgence, sparked by belief that Fed rate cuts will come earlier than anticipated following a softer-than-expected inflation report, raises questions about whether small caps are on the cusp of an extended rotation.
JHI
Figure 1: A shift in sentiment toward small caps
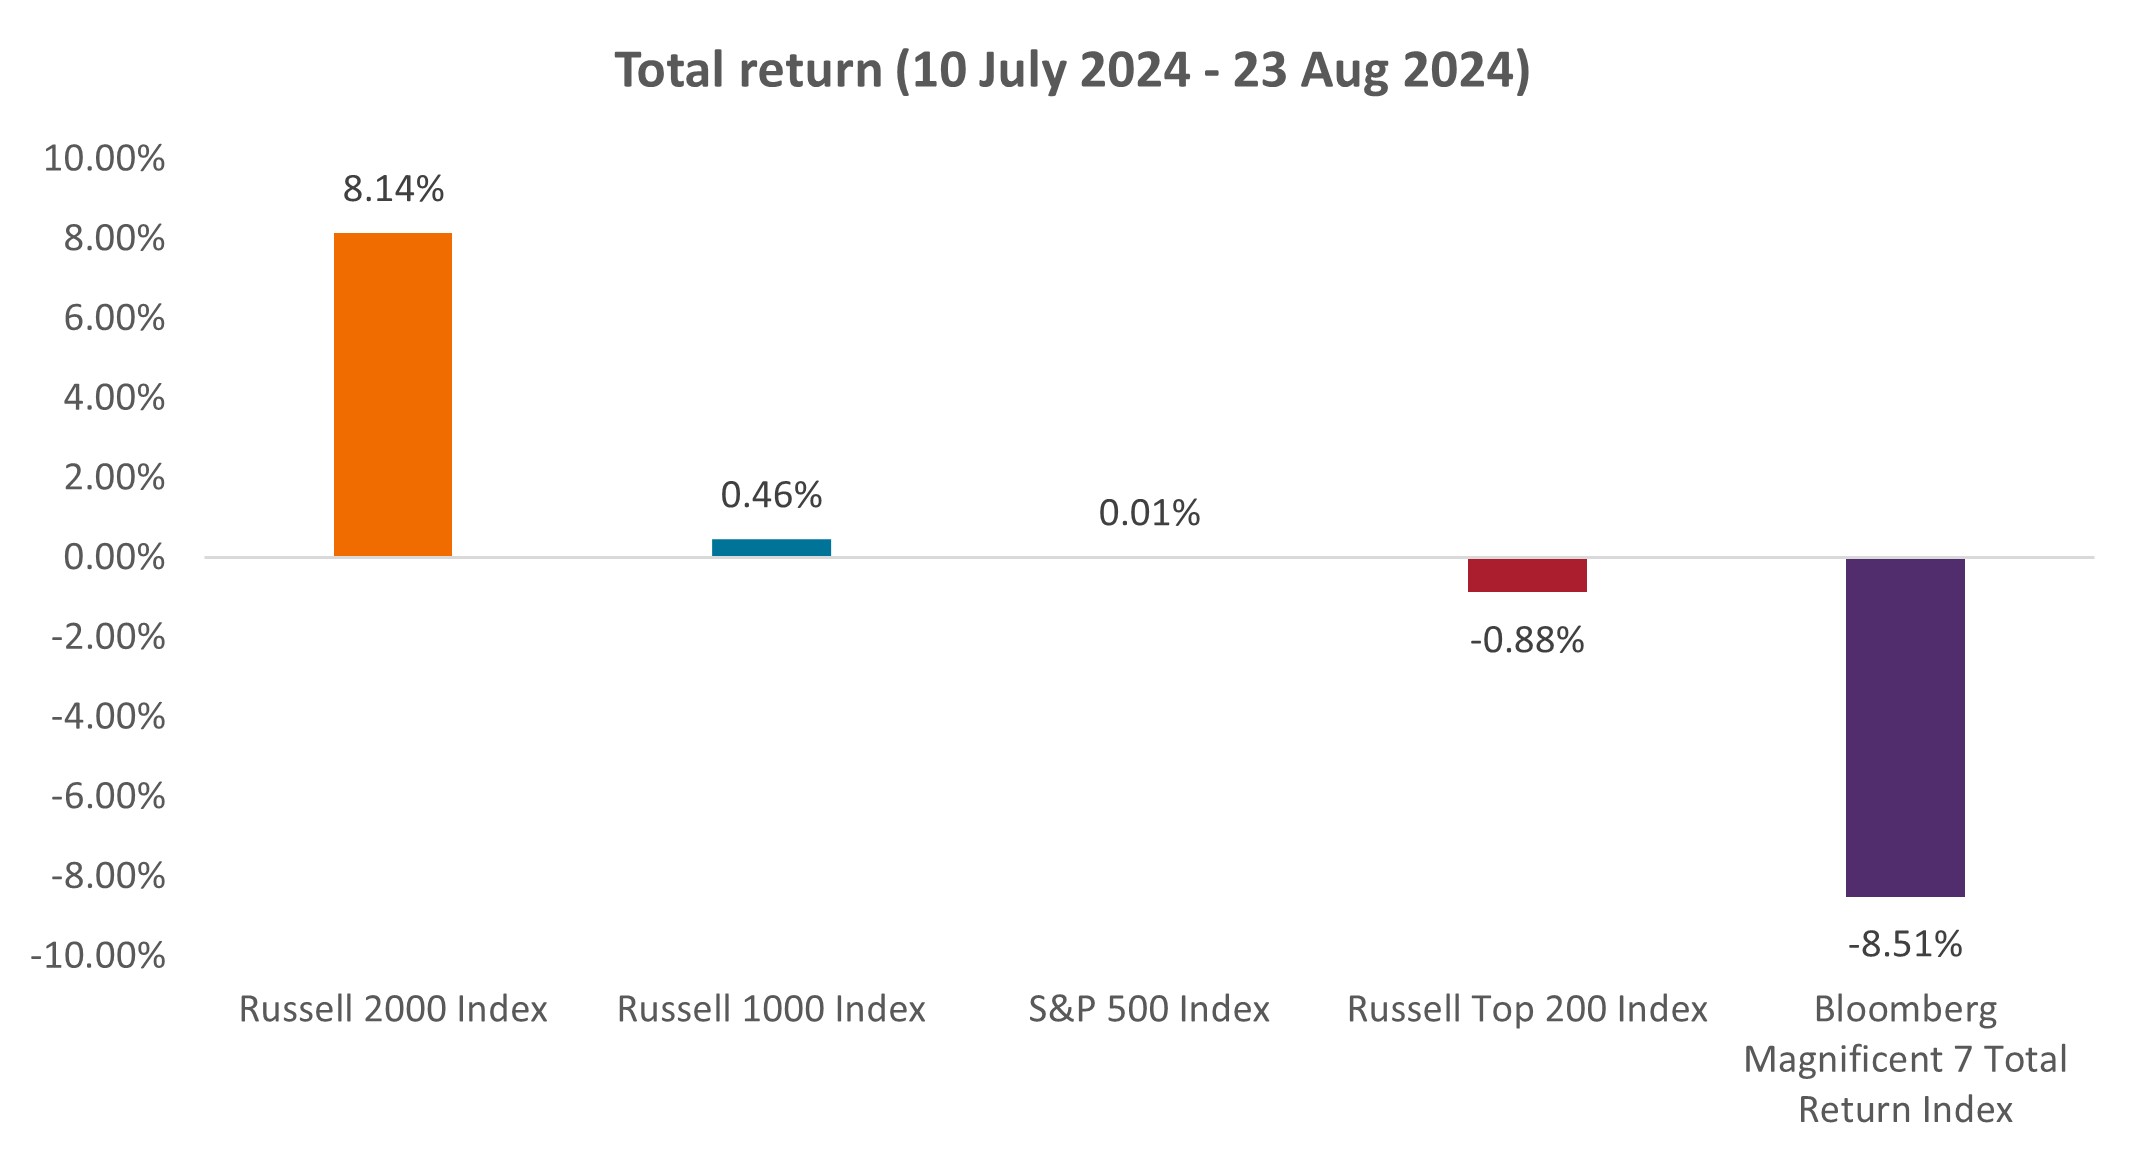 Source: Bloomberg, as at 23 August 2024.
Echoes of past rotations
The current rotation is particularly noteworthy because it comes at a time when small caps are at historical levels of underperformance and relative valuation compared to large caps. The performance lag has persisted for roughly 13 years and is approaching the upper end of typical out/underperformance cycles, which historically have lasted between six and 14 years (Figure 2).
Figure 2: Periods of small- and large-cap relative outperformance tend to occur in long cycles
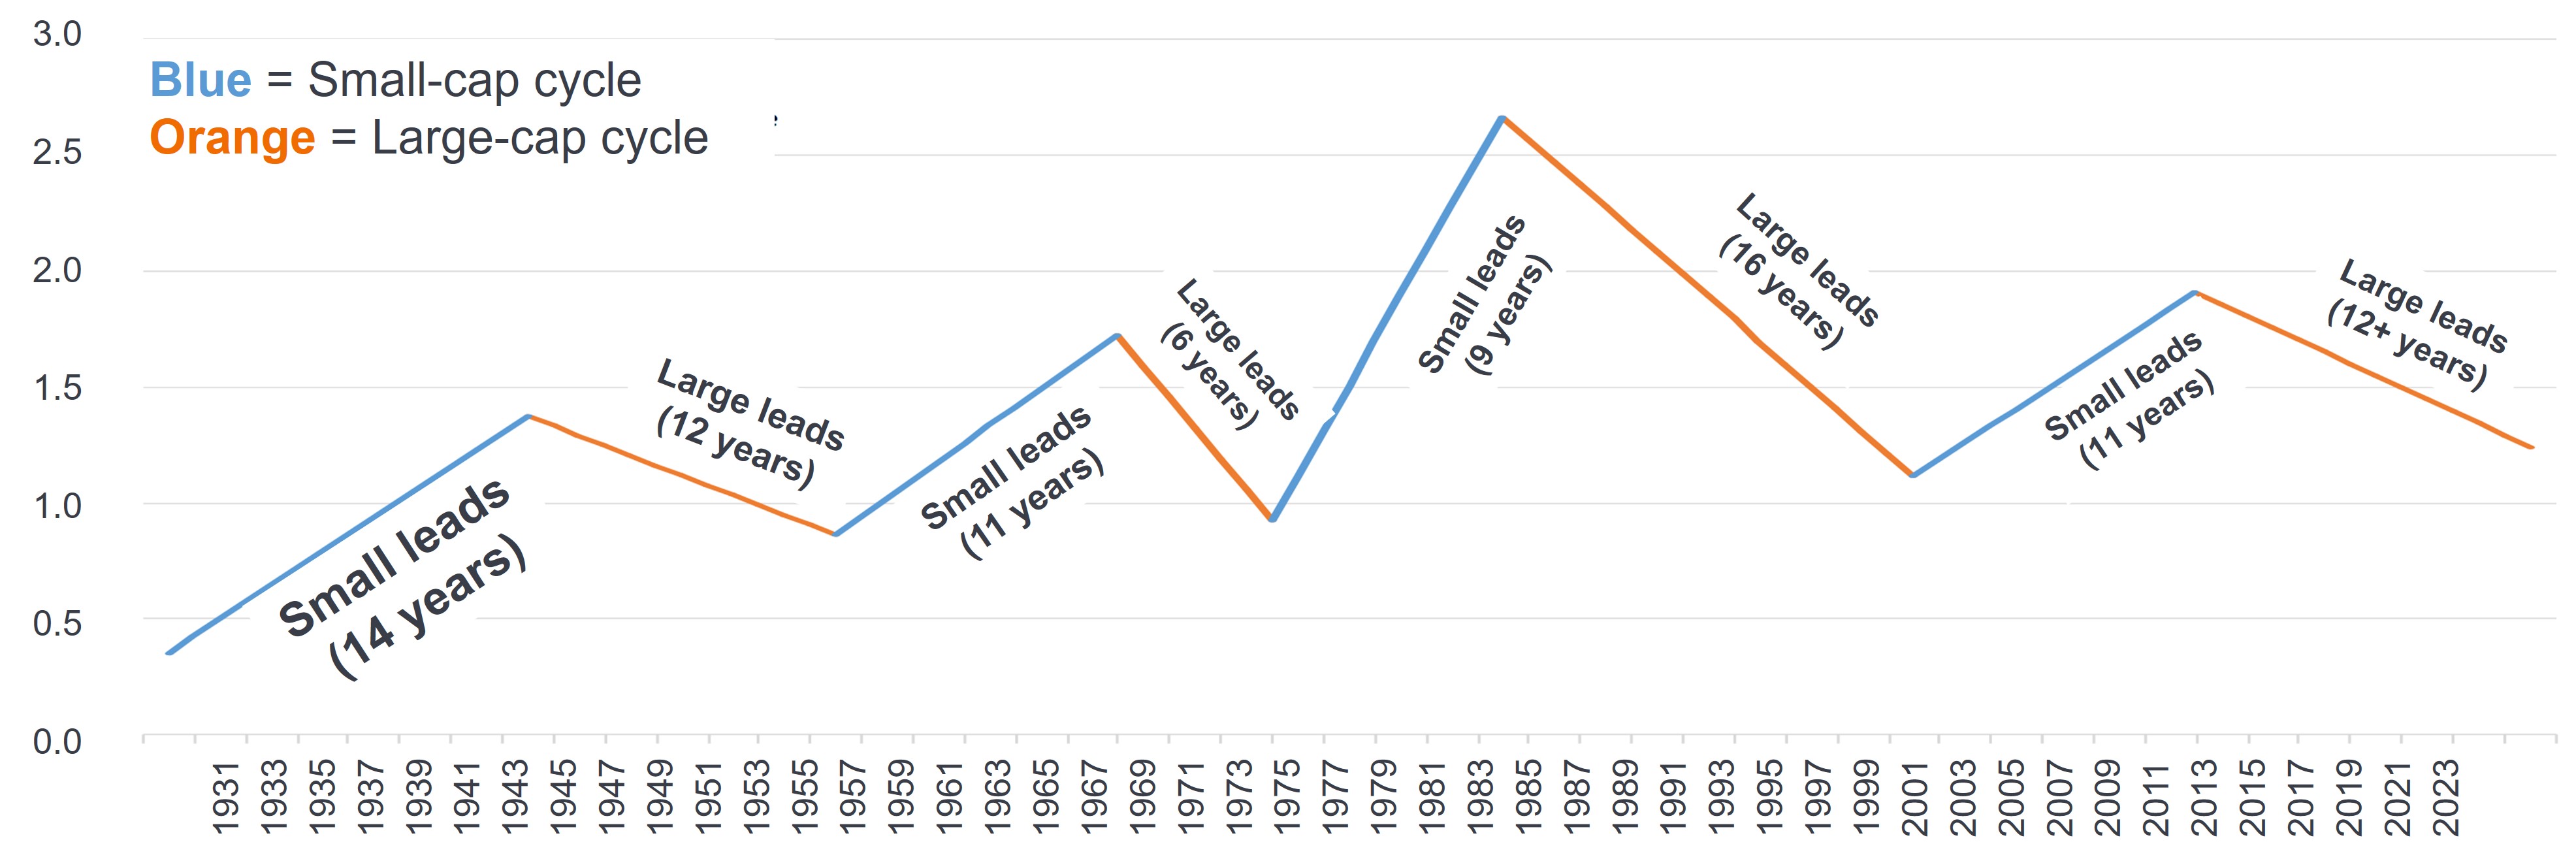
Source: Furey Research Partners (FRP), FactSet, Morningstar, as at 31 December 2023.
The current environment echoes past periods preceding extended small cap outperformance. The 1970s and late 1990s offer compelling parallels, with market excitement concentrated on one predominant theme: When investors realized there was too much crowding at the top, a broadening occurred that benefited small caps significantly.
Furthermore, small caps have historically thrived when their market capitalization as a percentage of the total market falls below 5%, a threshold that has recently been crossed.1
Valuation gap: A window of opportunity
The extended period of large-cap dominance has led to a significant widening of the valuation gap between small- and large-cap stocks. The relative valuation of small caps versus large caps currently sits at the 16th percentile. Since the creation of the Russell 2000 Index in 1978, small caps have only been this inexpensive once before, in 1998-99, which preceded an 11-year stretch of small cap outperformance.2
We believe current valuations matter to future returns, and today’s disparity offers a compelling entry point. Historically, when small caps have reached current valuation levels, the worst outperformance on a five-year annualized basis has been 5% (Figure 3).
Figure 3: Starting at the current relative valuation level vs. large caps, small caps have historically produced five-year outperformance
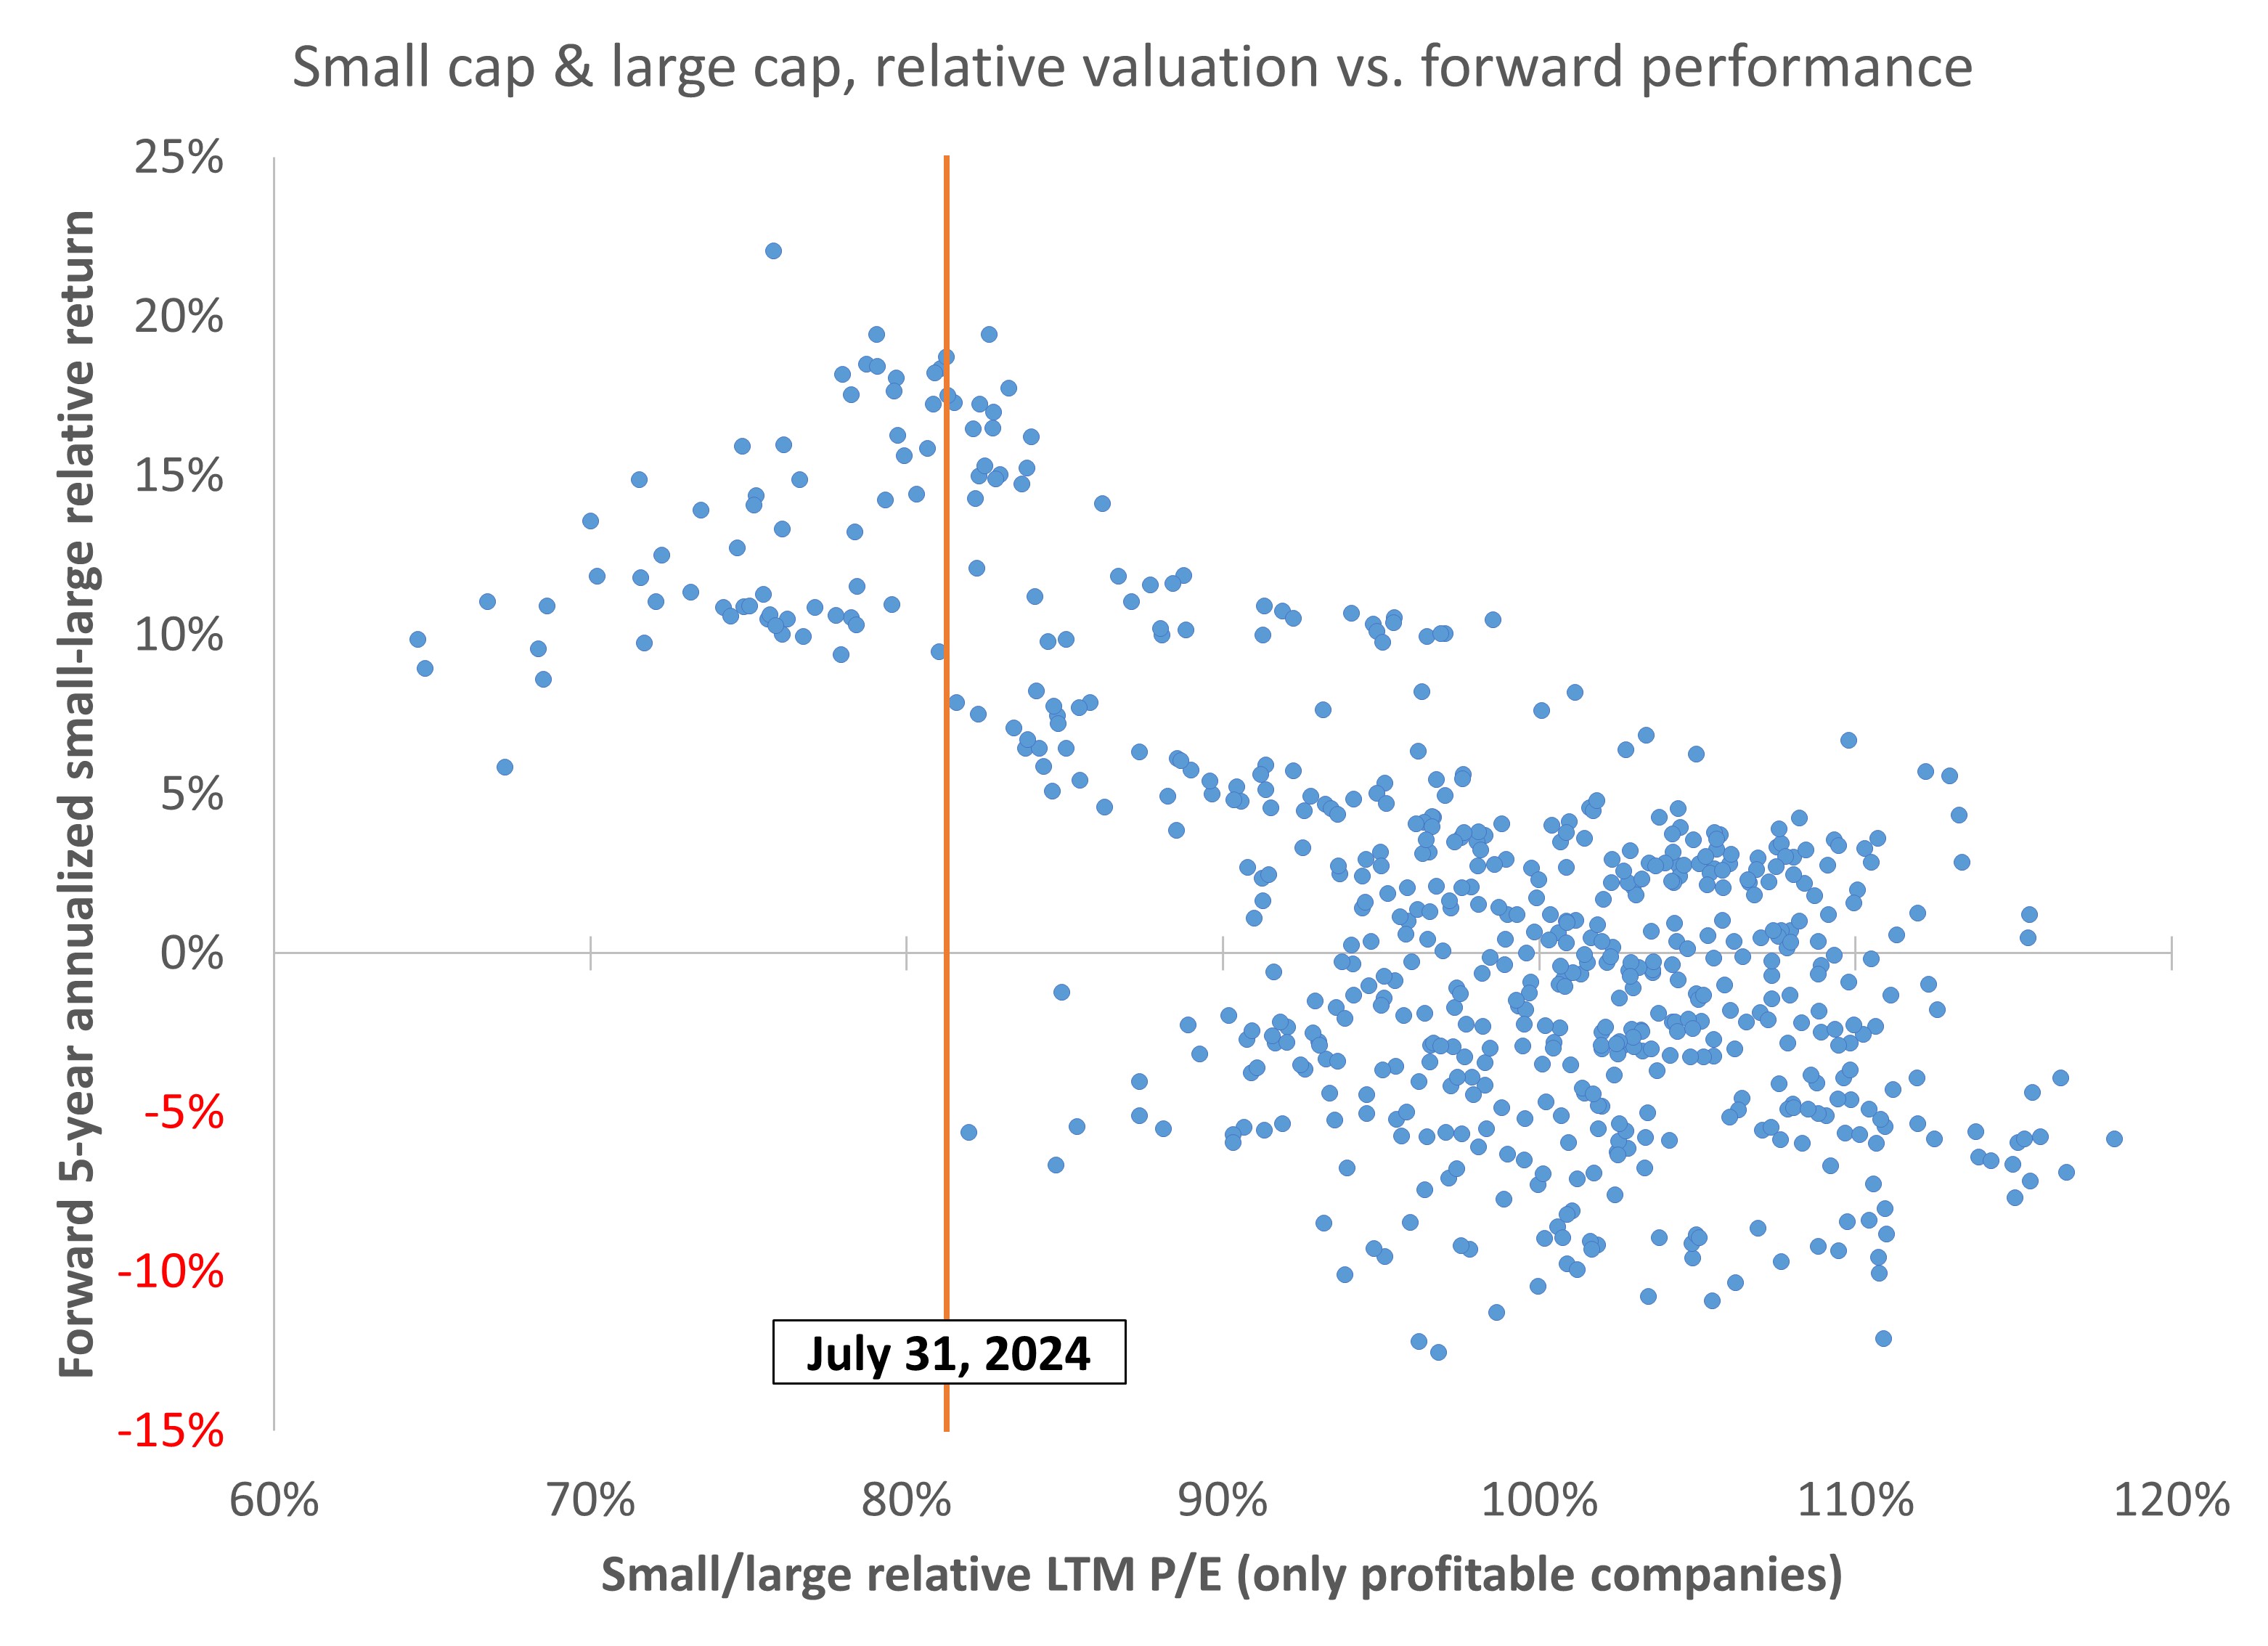 Source: Furey Research Partners (FRP), FactSet as at 31 July 2024. LTM P/E = last twelve months price to earnings.
Despite the recent bump in relative performance, opportunity remains in small caps. The rally has only slightly narrowed the valuation gap, akin to a lead-off home run in the first inning of a long baseball game.
Moreover, historical data suggest that strong initial performance often precedes extended periods of positive absolute returns for small caps. Analysis shows that after the Russell 2000 Index has been up over 10% in a five-day trading period, as was the case from 10 July to 17 July 2024, it has historically gone on to produce a positive return over the following 12-month period 100% of the time.3
Current catalysts
The macroeconomic and fundamental pictures both bode well for the asset class. Small caps have historically excelled during periods of declining inflation and in the early stages of Fed rate cuts. With inflation easing and markets pricing in potential cuts this year, smaller companies may find themselves in a favorable environment.
Lower inflation could disproportionally benefit small caps’ earnings expansion due to their typically lower pricing power and higher labor intensity compared to larger counterparts. Analysis shows that when inflation rates are above 3% and falling, small caps have outperformed large caps by nearly 1,000 basis points. When inflation rates are below 3% and falling, small caps still outperformed by about 300 basis points.4
Additionally, small caps have historically outperformed large caps by roughly 10% in the first 12 months following an initial Fed rate cut.5 The potential return to a normalized cost of capital could serve as a boost to small cap earnings. As financial conditions ease, smaller companies may find it easier to access funding for growth – a crucial factor in their value creation equation. With the average small-cap company holding roughly 42% floating-rate debt, lower interest rates could naturally flow through to improved profitability.6
Certain secular trends also favor small caps. For one, the ongoing deglobalization of supply chains, often referred to as reshoring or “onshoring,” could benefit small-cap companies due to their tendency to have greater exposure to the U.S. economy.
Active security selection key in bifurcated market
While the factors we’ve outlined are positive for small caps overall, one of the bigger hurdles for investors is a bifurcated market. There is wide dispersion in valuations, quality, and growth prospects within the small-cap universe. For instance, some companies are very highly valued on multiples of revenue, and approximately 36% of companies in the Russell 2000 are currently unprofitable.7 In our view, the heterogenous nature of the asset class highlights the need for an active approach and a focus on well-managed firms with strong fundamentals.
For growth-oriented investors, small caps may offer exposure to innovative companies at the forefront of emerging industries. We believe a focus on dynamic and profitable early-stage growth companies with strong unit economics and the ability to self-finance their growth is key to successfully navigating the space.
In the value universe, investors should be wary of high-leverage companies and those with low return on equity (ROE), which have historically underperformed over the long term.8 While periods of low interest rates can temporarily mask these issues, we believe a focus on quality – specifically solid balance sheets, strong free cash flow, and manageable debt levels – tends to be beneficial over longer time periods.
Reassessing portfolio allocations
Instead of trying to predict the exact timing of a potential market rotation, investors may instead focus on the fact that the long-term case for small cap exposure in a well-diversified portfolio remains compelling.
Additionally, the current combination of attractive valuations and improving cost of capital conditions coupled with the natural ebb and flow of market cycles suggests that we may be entering an extended, favorable period for small caps. As this potential shift unfolds, investors should consider their strategic asset allocations and assess whether they are suitably positioned to benefit from the improving prospects of the asset class.
1 Source: Center for Research in Security Prices (CRSP®), The University of Chicago Booth School of Business; FactSet; FTSE Russell; Jefferies
2 Source: Jefferies, Steven DeSanctis, CFA, as at 19 August 2024. Note: Valuation model consists of relative Trailing and Forward P/E, Price to Book, Price to Sales and from 2002 Price to Cash Flow; from 31 March 2016 forward Jefferies’ estimates. Data from FactSet; FTSE Russell; Jefferies.
3 Factset, Janus Henderson Investors Analysis. 17 observations beginning 1 January 2000 through 29 July 2024.
4 Jefferies, Equity Research, 19 August 2024. Center for Research in Security Prices (CRSP®), The University of Chicago Booth School of Business; Jefferies.
5 Source: Jefferies, Equity Research, 19 August 2024. Federal Reserve Board; Haver Analytics; Center for Research in Security Prices (CRSP®), The University of Chicago Booth School of Business; Jefferies.
6 Furey Research Partners (FRP), as at August 2024.
7 Source: Jefferies, Equity Research, 13 August 2024. Russell data as of 31 July 2024, and profitability measures were through Q2 2024.
8 Source: Janus Henderson Investors analysis as at 31 March 2024, data FactSet, Russell 2000 Value Index. Note: Leverage is LTM Total Debt/LTM EBITDA (LTM = Last Twelve Months).
Basis point (bp) equals 1/100 of a percentage point. 1 bp = 0.01%, 100 bps = 1%.
The Bloomberg Magnificent 7 Total Return Index is an equal-dollar weighted equity benchmark consisting of a fixed basket of 7 widely-traded companies classified in the United States and representing the Communications, Consumer Discretionary and Technology sectors as defined by Bloomberg Industry Classification System (BICS).
Free cash flow (FCF) yield is a financial ratio that measures how much cash flow a company has in case of its liquidation or other obligations by comparing the free cash flow per share with the market price per share and indicates the level of cash flow the company will earn against its share market value.
Russell 2000® Index reflects the performance of U.S. small-cap equities.
Russell 1000® Index reflects the performance of U.S. large-cap equities.
Russell Top 200® Index reflects the performance of the largest capitalization segment of U.S. large-cap equities and consists of the largest 200 companies in the Russell 3000 Index.
S&P 500® Index reflects U.S. large-cap equity performance and represents broad U.S. equity market performance.
Return on Equity (ROE) is the measure of a company’s annual return (net income) divided by the value of its total shareholders’ equity, expressed as a percentage. The number represents the total return on equity capital i.e., the profits made for each dollar from shareholders’ equity.
IMPORTANT INFORMATION
Equity securities are subject to risks including market risk. Returns will fluctuate in response to issuer, political and economic developments.
Smaller capitalization securities may be less stable and more susceptible to adverse developments, and may be more volatile and less liquid than larger capitalization securities.
These are the views of the author at the time of publication and may differ from the views of other individuals/teams at Janus Henderson Investors. References made to individual securities do not constitute a recommendation to buy, sell or hold any security, investment strategy or market sector, and should not be assumed to be profitable. Janus Henderson Investors, its affiliated advisor, or its employees, may have a position in the securities mentioned.
Past performance does not predict future returns. The value of an investment and the income from it can fall as well as rise and you may not get back the amount originally invested.
The information in this article does not qualify as an investment recommendation.
There is no guarantee that past trends will continue, or forecasts will be realised.
Marketing Communication.
Important information
Please read the following important information regarding funds related to this article.
6 minute read
Key takeaways:
- Since early July, small-cap stocks have outperformed large caps, with performance spurred by expectations for a sooner-than-later start to the Federal Reserve’s (Fed) rate-cutting cycle.
- The combination of attractive relative valuations, the potential for improving cost of capital conditions, and the natural progression of market cycles suggests a more favorable period for small cap stocks ahead.
- Still, wide dispersion in both small-cap valuations and company fundamentals highlight the need for an active and selective approach to effectively navigate the asset class.


