Investing in AI? It’s no place for passive
The complexity of artificial intelligence demands an active investment approach to effectively identify opportunities and offer genuine market exposure to investors.

5 minute read
Key takeaways:
- Passive AI strategies are unlikely to offer the exposure investors crave.
- Index providers are typically blending the AI story with a broader technology allocation.
- Active strategies remain better placed to account for a constantly evolving AI market.
Index providers have begun offering up passive products at super low cost on the premise that investors can get exposure to all the upside potential of AI, but without the costs of active management.
This is very much “theme washing” as we address in our paper ‘Thematic Investing: A Practitioners Guide’ and we remain concerned that investors are being sold a marketing story rather than the exposure to AI they expect due to primitive methodologies being applied to a highly complex market.
How passive strategies work
Before I explain why passive isn’t the place for AI, it’s important to take a step back and look at how an index exposure works.
An index is created by using a mathematical formula to allocate between securities in a particular market segment. These market segments can cover a broad range of areas including country, region, sector, theme, style.
There are two points to note here:
- The rules/formula around the index are determined before the index launches and do not change
- The criteria for determining the market segment (i.e. what’s in / out of scope) is also set prior to launch and does not change
While the companies that are included in the index will change over time –the criteria for selection will not.
This can work well in large, established markets where structural changes are gradual (e.g. gaining exposure to the S&P 500, MSCI ACWI). It doesn’t work in rapidly changing markets where the sector or industry can look significantly different over the next 12 months let alone the next 5-10 years.
This is where AI index products fall flat.
Road-testing AI ETFs
To draw this conclusion, as a team we put ourselves into the seat of our investors and started trawling the market to see what was available. Being based in Europe, we came across three exchange traded funds (ETFs) that were offering AI index exposures.
This brings us to the first challenge:
Problem 1: There is no single definition of AI
What became particularly clear, was that index providers all had a completely different take on what should be included in an AI index, blending the AI story with a broader technology allocation. For example, AI was being blended with Big Data (which can mean many things), Robotics, Autonomous Tech, and in one instance, the Technology category as a whole.
This isn’t saying such blends are inappropriate investments, but they are not AI indexes.
What was particularly extraordinary was how the returns differed between the three AI ETFs (exhibit 1) over a reasonably short period of time – in this case three years. The cumulative difference between the best and worst AI ETF performance over this time was 25%!
Exhibit 1: AI ETF passive investing return spread/asset allocation
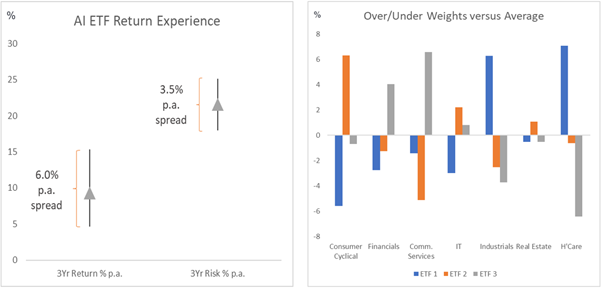
Source: Morningstar, Janus Henderson Investors, Tradewind Comparison Report, 1 May 2021- 30 April 2024. Past performance does not predict future returns.
Why was this? All were marketed as AI passive ETFs – even if the compositions were different.
Further, factor drivers (in this case value vs growth and large vs small cap) vary so differently between the ETFs. They are generally growth oriented, but some have more value, and the market capitalisation changes materially.
This is important because the perception of passive investing is that you’re getting exposure to a broad market. Yet we can see from the returns and factor drivers provided by each AI ETF give completely different outcomes.
This compares with say an S&P 500 ETF where we know exactly the exposure provided irrespective of the ETF provider used. This is evident if you take the top five ETF providers by assets under management and compare the returns to the S&P 500 Index (exhibit 2).
Exhibit 2: S&P500 passive investing return spread/asset allocation

Source: Morningstar, Janus Henderson Investors, Tradewind Comparison Report, 1 May 2021- 30 April 2024. Past performance does not predict future returns.
Problem 2: Questionable purity
Aside from the definition of AI, one of the key causes for this divergence in returns comes from a lack of purity from the companies selected in an index. AI in its truest form is quite a narrow market and there are very few companies that generate the vast majority of their revenue from AI.
As such, the AI indexes have a relatively low minimum threshold for what constitutes an AI company to ensure a sufficient population of securities exist.
Going back to our three AI ETFs and looking at their top 10 holdings, global conglomerates such as Bank of America, Amazon, Samsung and Apple all featured prominently. These are companies that utilise AI, but you would be hard pressed to make an argument why they are AI dominant businesses.
Problem 3. Forcing fixed rules on a dynamic market
The AI market is constantly changing, with it likely to play a major role in reshaping the global economy, leading analysts to expect the industry to grow to over US$ 1.8 trillion by the end of the decade, according to data provider Statista.
In a constantly evolving market, no set of rules can capture what the future of AI looks like and, therefore, while it is an exciting sector to invest in, we’re only at the very early stages of understanding what it can do.
What we know for certain, however; is that we cannot rely upon a simple set of rules and broad-based exposures for investing in such a dynamic vertical.
Active investing: An investment management approach where a fund manager actively aims to outperform or beat a specific index or benchmark through research, analysis and the investment choices they make. The opposite of Passive Investing.
Asset allocation: The allocation of a portfolio between different asset classes, sectors, geographical regions, or types of security, to meet specific objectives of risk, performance or time horizon.
Exchange traded fund (ETF): A security that tracks an index, sector, commodity or pool of assets (such as an index fund). ETFs trade like an equity on a stock exchange and experience price changes as the underlying assets move up and down in price. ETFs typically have higher daily liquidity and lower fees than actively managed funds.
Exposure: The amount an investor stands to lose should an investment fail. It is another way of describing financial risk.
Index: A statistical measure of group of basket of securities, or other financial instruments. For example, the S&P 500 Index indicates the performance of the largest 500 US companies’ stocks. Each index has its own calculation method, usually expressed as a change from a base value.
Large caps: Well-established companies with a valuation (market capitalisation) above a certain size, eg. US$10 billion in the US. It can also be used as a relative term. Large-cap indices, such as the UK’s FTSE 100 or the S&P 500 in the US, track the performance of the largest publicly traded companies, rather than all stocks above a certain size.
Passive investing: An investment approach that involves tracking a particular market or index. It is called passive because it seeks to mirror an index, either fully or partially replicating it, rather than actively picking or choosing stocks to hold. The primary benefit of passive investing is exposure to a particular market with generally lower fees than you might find on an actively managed fund. The opposite of active investing.
Small caps: Companies with a valuation (market capitalisation) within a certain scale, eg. US$300 million to US$2 billion in the US, although these measures are generally an estimate. Small cap stocks tend to offer the potential for faster growth than their larger peers, but with greater volatility.
These are the views of the author at the time of publication and may differ from the views of other individuals/teams at Janus Henderson Investors. References made to individual securities do not constitute a recommendation to buy, sell or hold any security, investment strategy or market sector, and should not be assumed to be profitable. Janus Henderson Investors, its affiliated advisor, or its employees, may have a position in the securities mentioned.
Past performance does not predict future returns. The value of an investment and the income from it can fall as well as rise and you may not get back the amount originally invested.
The information in this article does not qualify as an investment recommendation.
There is no guarantee that past trends will continue, or forecasts will be realised.
Marketing Communication.
5 minute read
Key takeaways:
- Passive AI strategies are unlikely to offer the exposure investors crave.
- Index providers are typically blending the AI story with a broader technology allocation.
- Active strategies remain better placed to account for a constantly evolving AI market.


