Market review
Global economic worries allowed yields to fall and yield curves to steepen through July, as the global easing cycle extended. The Australian bond market, as measured by the Bloomberg AusBond Composite 0+ Yr Index, rose 1.48%.
A weaker global economic backdrop and local inflation relief allowed yields to fall through July.
Australia’s three-year government bond yields ended the month 32 basis points (bps) lower at 3.76%, while 10-year government bond yields were 20bps lower at 4.12%. Against the current cash target rate of 4.35%, three-month bank bills ended 4 bps higher at 4.49%. Six-month bank bill yields ended 5bps higher at 4.78%. The Australian yield curve steepened, as the market started to price in a local easing cycle. The US bond market led the moves, with its own curve steepening.
Much of the month saw local markets holding their breath for the quarterly inflation print, worried about a possible late cycle Reserve Bank of Australia (RBA) tightening. The fears did not come to pass, with headline inflation ticking up to 3.8% year on year (yoy), but the underlying measure unexpectedly moderated to 3.9% yoy. This allows the RBA to focus on the other part of its dual mandate, full employment. While the headline employment print was solid, there are underlying cracks starting to point towards softening from strength in the labour market.
The global economic backdrop also moderated in the month, with purchasing manager indexes (PMIs) moderating in the euro area and the US, with China remaining more sluggish than expected. This was reflected in weaker commodity prices. The Bank of Canada lowered its interest rate, while the US Federal Reserve and European Central Bank both signalled that they are likely to ease in coming months.
Market outlook
The outlook remains complex, amid a myriad of competing pressures in the economy and from geopolitical and structural pressures. The Australian economy is slowing gently, and while no recession is forecast, the pressure of higher interest rates is expected to continue to broaden out across sectors of the economy. Inflation remains high and is moderating slowly. The RBA needs to balance these risks along their so-called narrow path. An extended period of policy at restrictive levels will further slow growth, rebalance the labour market and subdue inflation. The global economic backdrop is slowing, but a growing number of geopolitical and structural concerns, such as elections and government debt concerns, raise market volatility risks.
Our base case is for the RBA to remain on hold at current rates before commencing an easing cycle in Q1 2025. We price a more modest than the historically average easing cycle, of around 175bps, spread over an extended period. There remain a myriad of risks to the base case, with the high case of a late cycle hike in H2 2024, and a slow cycle easing through to 2026. Post the inflation data, and given the rise in global slowing, this risk has eased back of late. We hold an alternate case of a modestly earlier commencement, which finishes with slightly more easing over the whole cycle. This is equally possible as the high case, under the current environment.
The market has built in an RBA easing cycle, with around 100 basis points priced over two years. This is a start, but we believe that there is more to come, as the RBA allows policy to become accommodative over the cycle. We currently consider the Australian yield curve as under-valued at points in the curve.
Monthly focus – Australian labour markets: Path to adjustment
Australia’s labour market is slowly coming off its post-pandemic highs, but the path to a weaker labour market tends to be non-linear. Maintaining an unemployment rate close to levels associated with “full employment” forms part of the RBA dual mandate, and they are cognizant of the potential to lose their hard fought employment gains as the economy slows.
With the re-opening of borders and pent-up net migration flows, labour supply pressures, which had held back businesses over recent years, have been easing. There has been strong growth in the labour force, from migration flows and continued increase in the participation rate. Growth has been such that the number of people entering the labour force each month has risen past 40,000 from a pre-pandemic 25,000. This will slow as net migration normalises, but with a higher population level, labour supply has now re-set higher.
Labour demand is concurrently easing back to more manageable levels, and in some cases moving to the lower half of historical norms. The headline facts would suggest a robust employment environment. Employment growth is running at an above average 2.8% yoy, while the unemployment rate at 4.1% is relatively close to estimates of full employment.
But delving a little deeper, there are increasing signs of cracking in the labour market. The more immediate clue is the weakening in full-time employment growth, which has dropped below average. The gains have been skewed toward part-time work, which is often a pre-cursor to lower outright labour demand; this also shows up in the rising underemployment rate. With monetary conditions remaining tight, the pressures are likely to remain on firms.
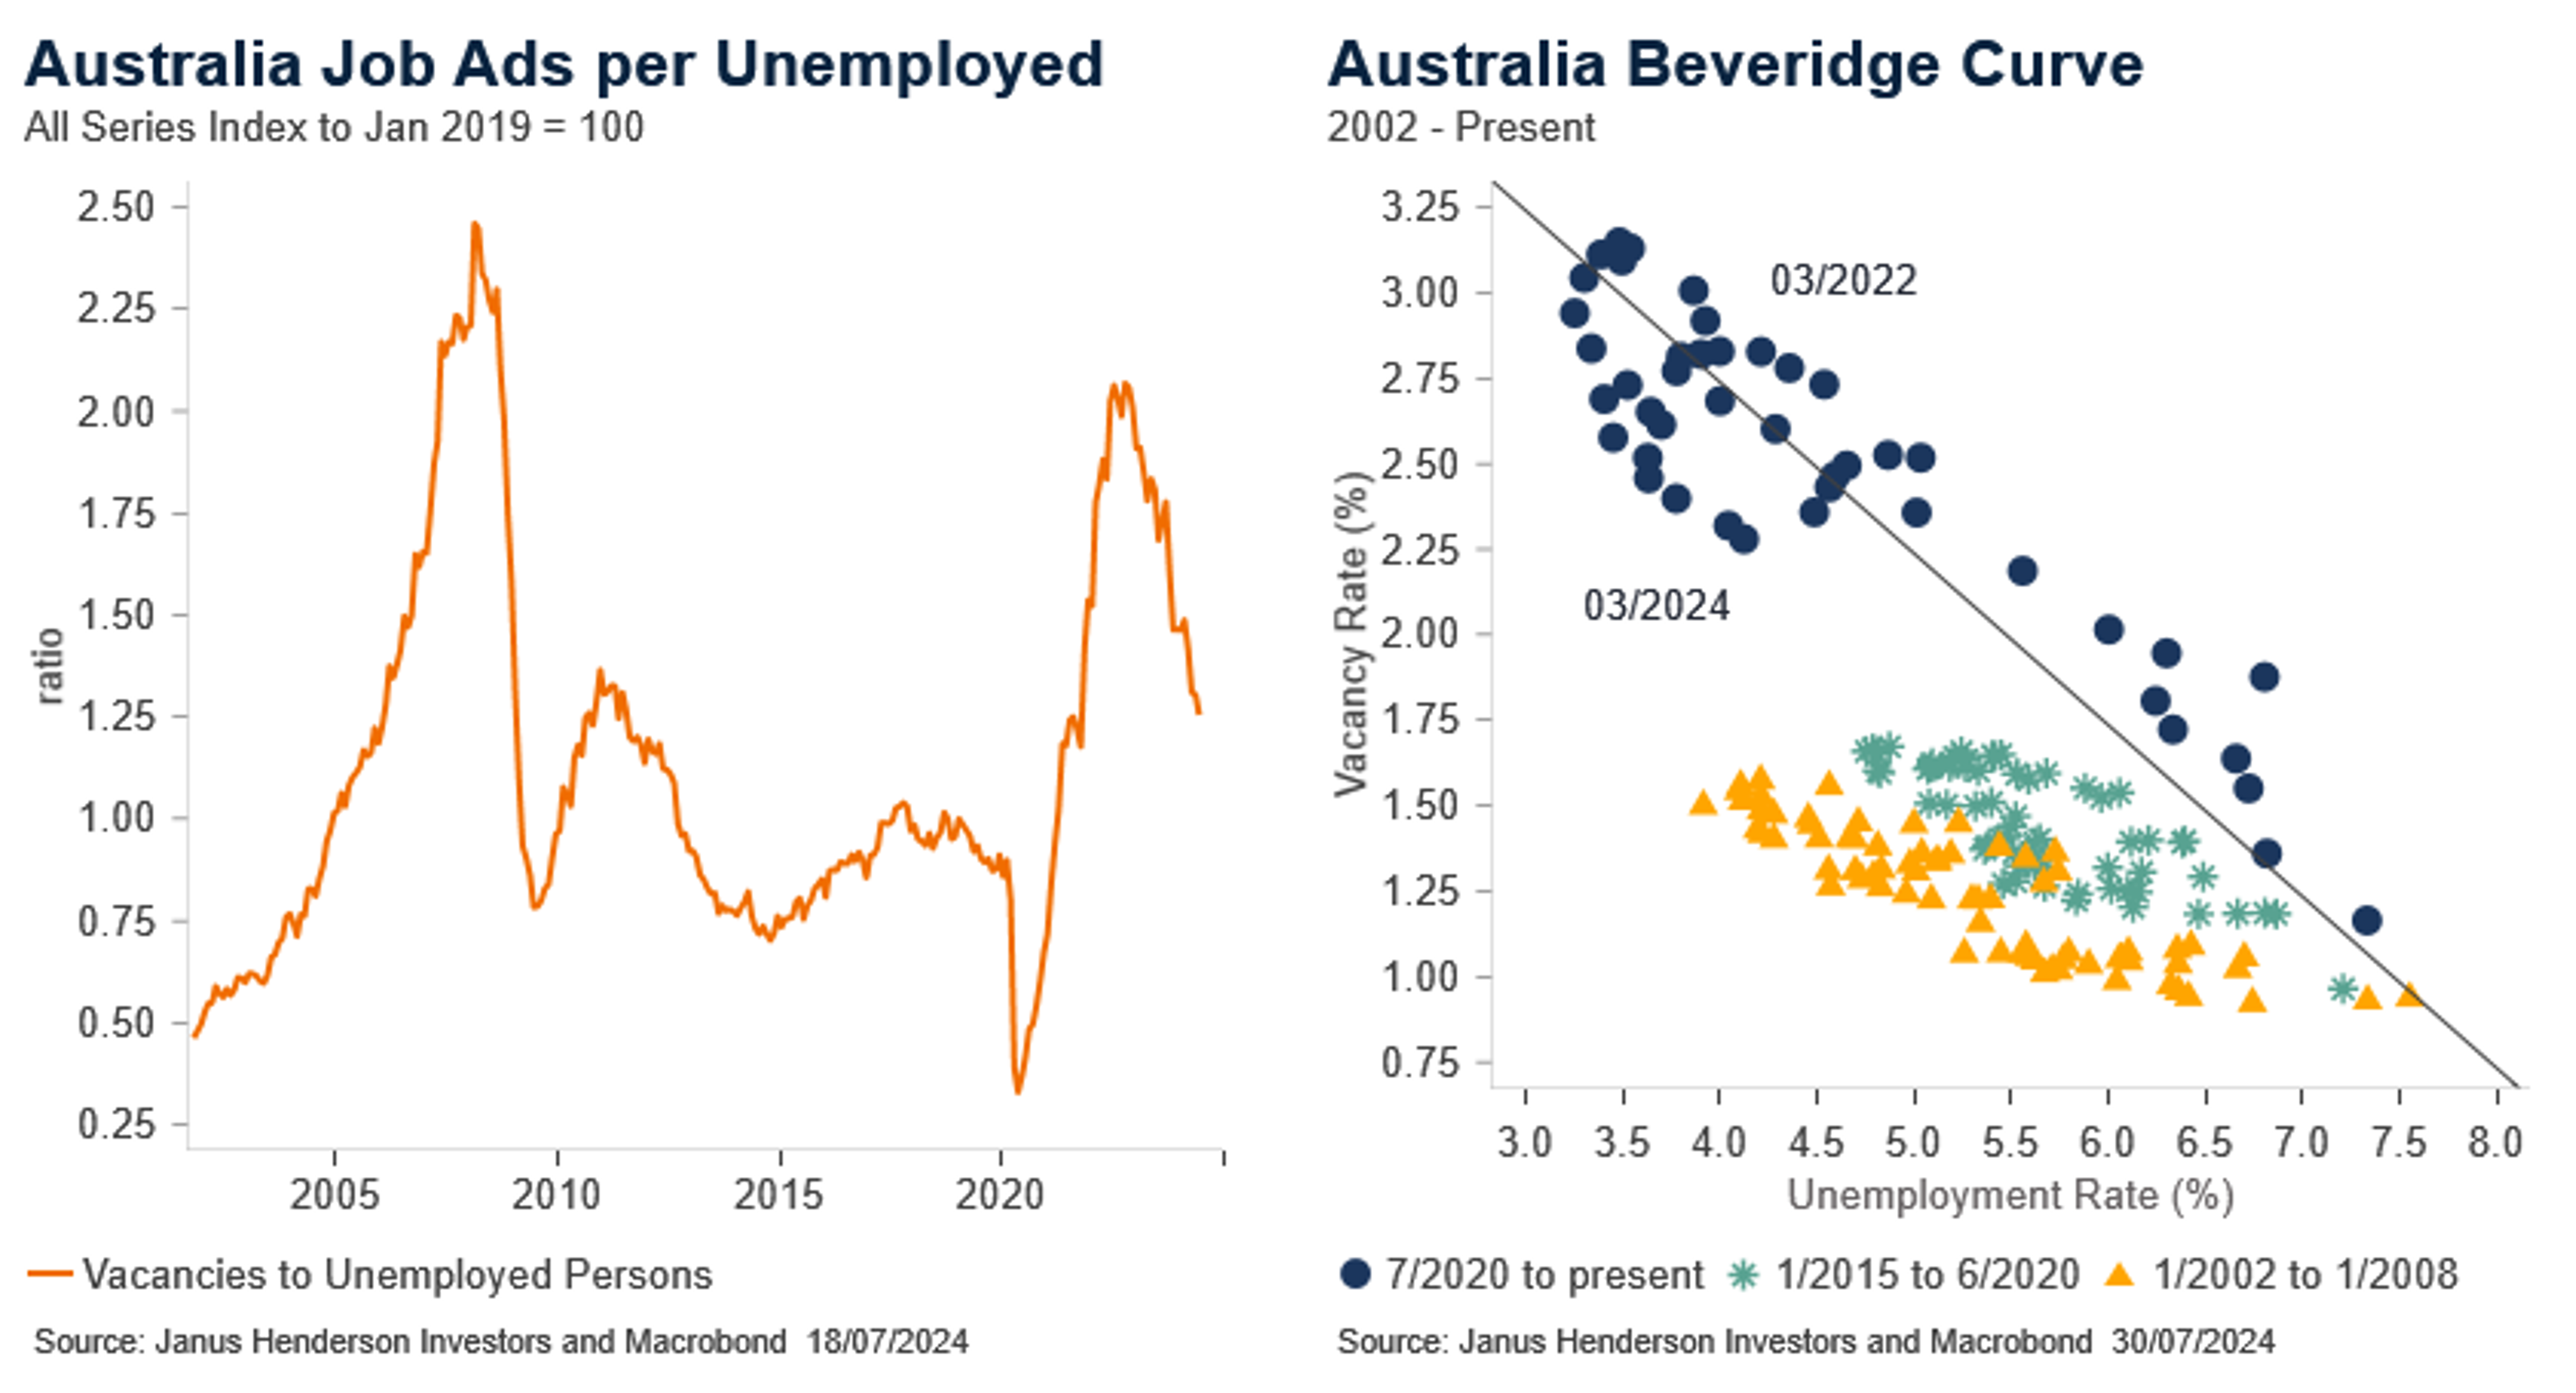
We can track the demand for new hires through job advertisements (ads). Job ads, in outright terms, remain high, as some post-pandemic hangovers continue. To adjust for growth in the economy, we examine the ratio of job ads per people looking for work (unemployed). From a surge in 2022, this has fallen to a ratio of 1.25, and moving toward more normal levels. Lower job ads are a precursor to a rise in the unemployment rate, defined by the Beveridge Curve. The Beveridge curve shows the non-linear and downward sloping relationship between ads and the unemployment rate. As job ads fall, the unemployment rate rises, at a faster rate.

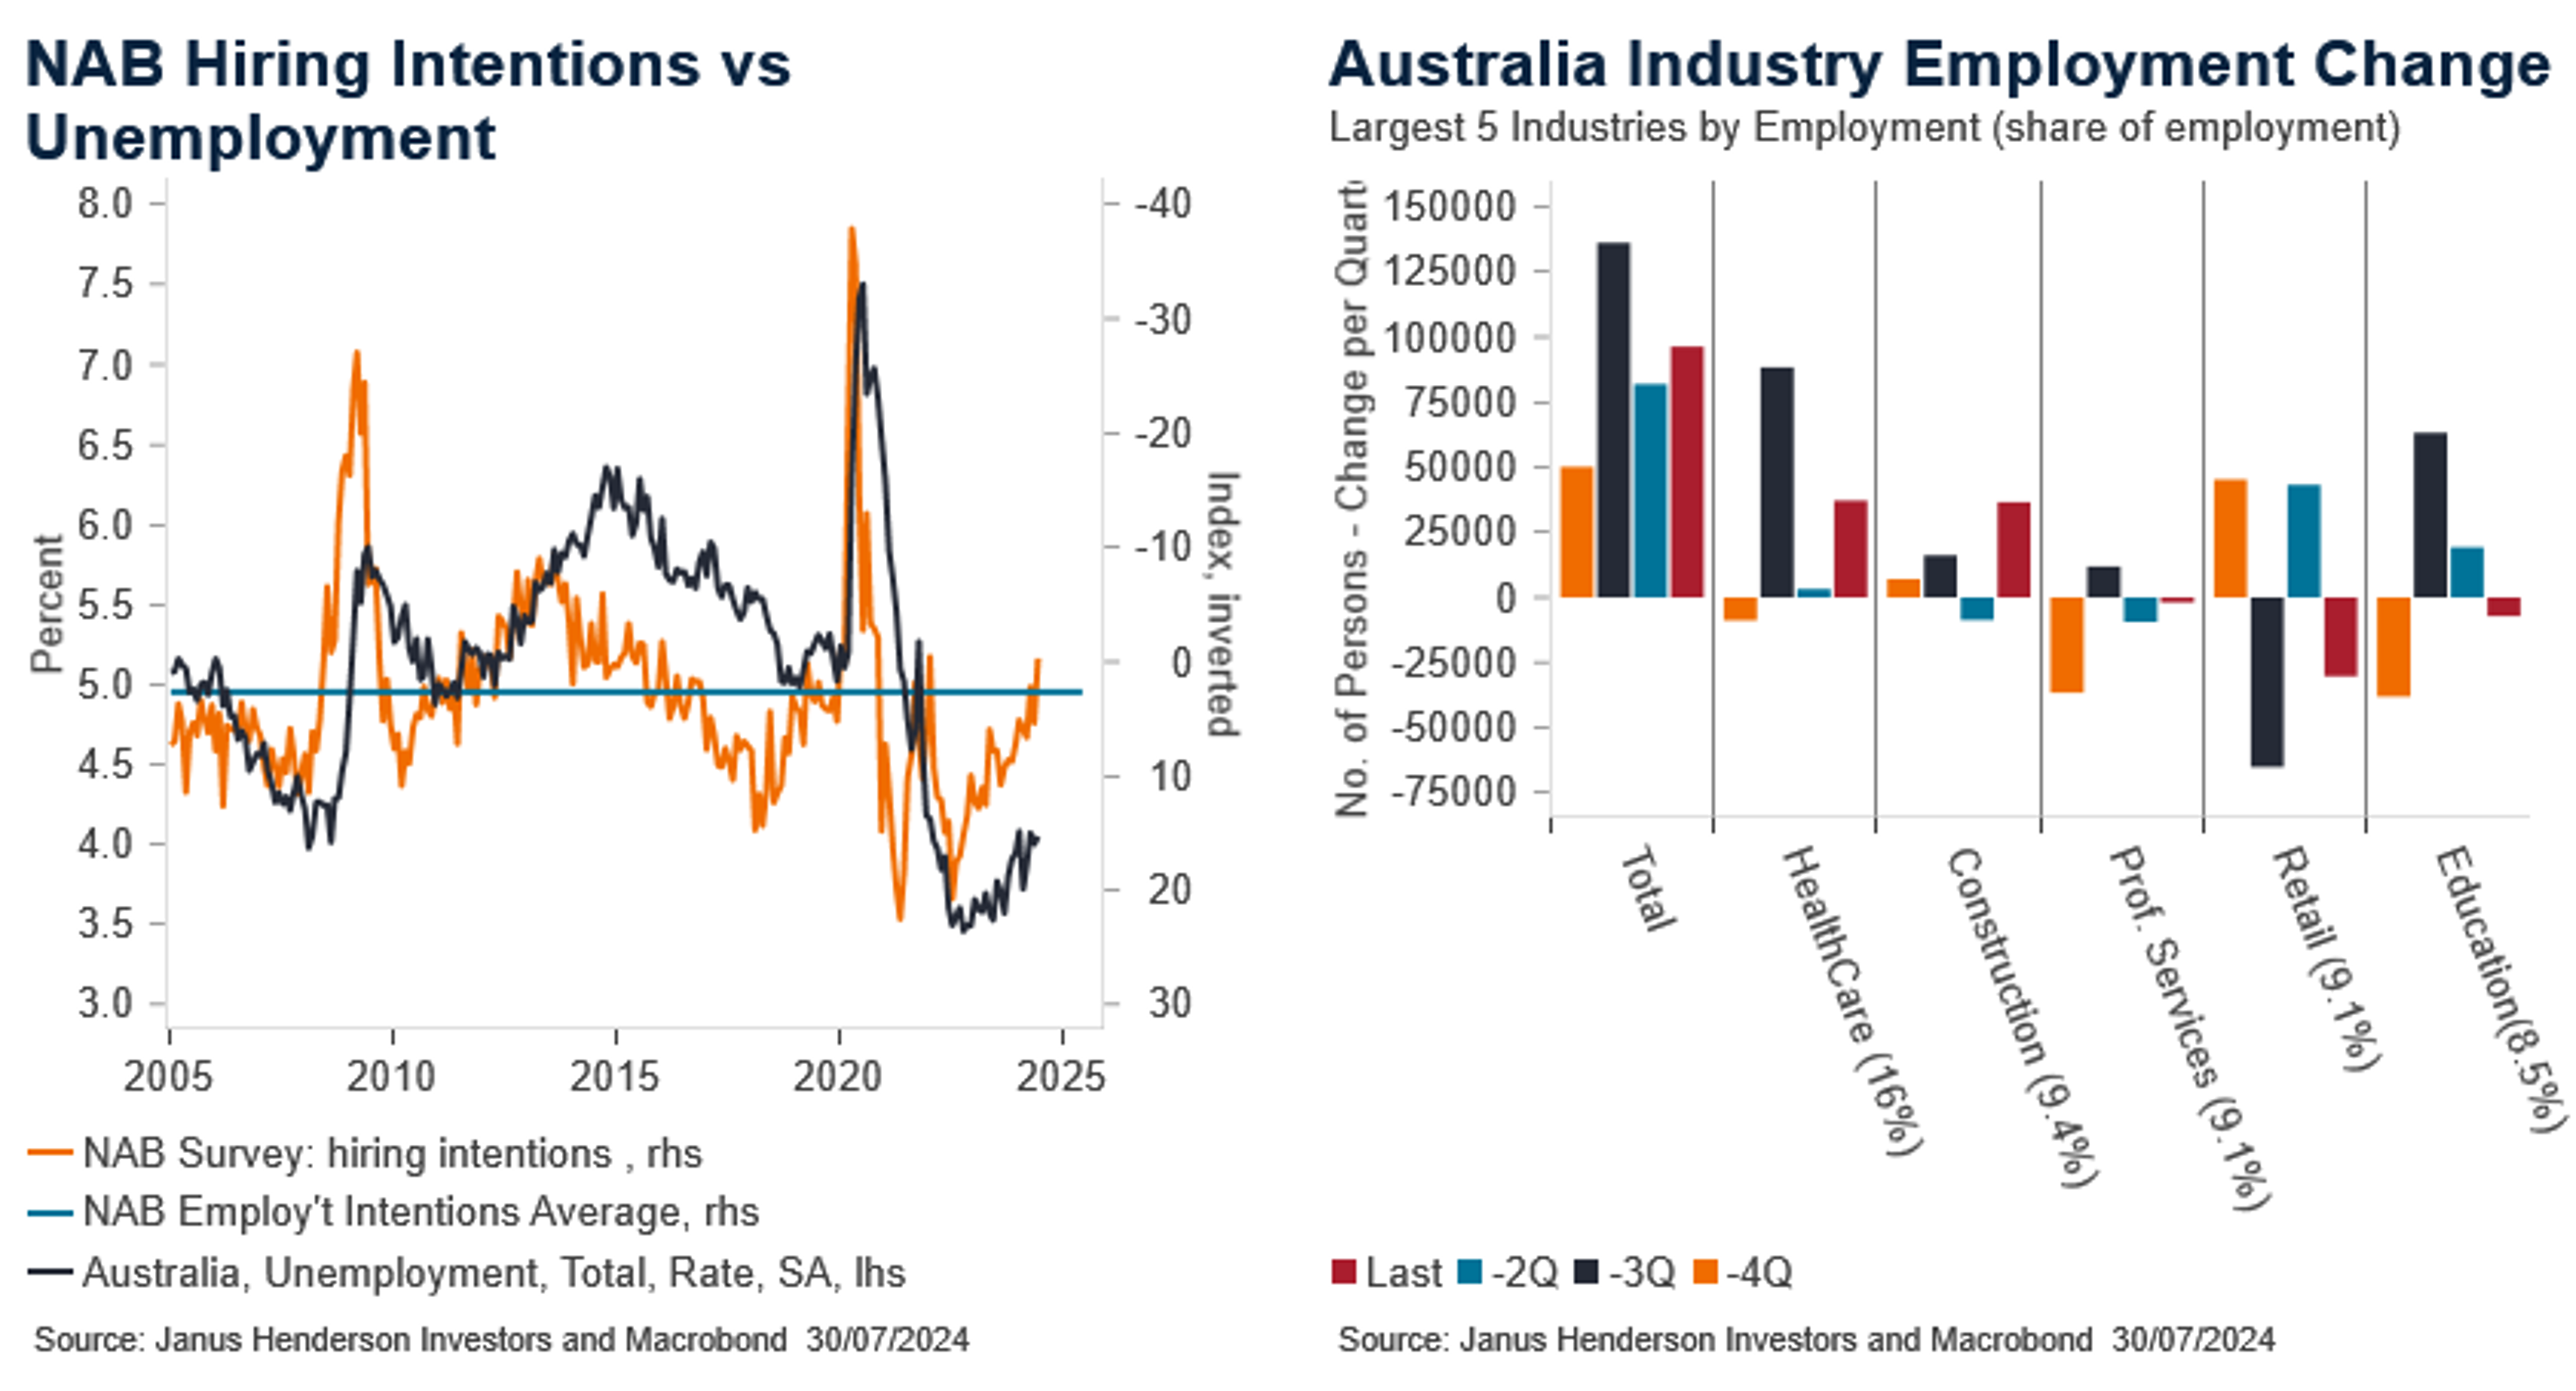
Demand for labour is also signalled by the NAB business survey of employment intentions. More recently, this measure has moved below average levels, into negative territory. This indicates a slight bias to lay-off workers and is historically associated with a rising unemployment rate. We also see a rising number of company insolvencies, reported by ASIC. Many of these are small and medium sized enterprises, which employ over 50% of Australia’s workers. New hiring is occurring in the significantly important health care sector, and more recently the construction sector, while the other large industries; retail, professional services and education show mixed to poor employment. Combined, these factors point to softening demand for new hiring over the coming months.

Overall, despite the strong headlines, labour supply is rising, demand is slowing, and the outcome leads to a higher unemployment rate. With the RBA now equally focussed on full employment, these dynamics will be a concern and are likely to move the RBA to consider their easing cycle.
Views as at 31 July 2024.
All opinions and estimates in this information are subject to change without notice and are the views of the author at the time of publication. Janus Henderson is not under any obligation to update this information to the extent that it is or becomes out of date or incorrect. The information herein shall not in any way constitute advice or an invitation to invest. It is solely for information purposes and subject to change without notice. This information does not purport to be a comprehensive statement or description of any markets or securities referred to within. Any references to individual securities do not constitute a securities recommendation. Past performance is not indicative of future performance. The value of an investment and the income from it can fall as well as rise and you may not get back the amount originally invested.
Whilst Janus Henderson believe that the information is correct at the date of publication, no warranty or representation is given to this effect and no responsibility can be accepted by Janus Henderson to any end users for any action taken on the basis of this information.