A “monetarist” perspective on current equity markets (July 2024)
Monetary analysis suggests a weakening economic outlook and falling inflation until early 2025; however a cyclical forecasting framework points to the possibility of strong economic growth in H2 2025 and 2026, according to Simon Ward, Economic Adviser.

7 minute read
Key takeaways:
- Monetary indicators are signalling a weakening global economy and declining inflation into early 2025, although a deep recession is unlikely.
- Downside economic and inflation surprises in H2 2024 could trigger a dramatic escalation of monetary easing, with a subsequent pick-up in money growth leading to an economic boom in H2 2025 / 2026.
- For now, non-tech cyclical sectors remain relatively expensive, and investors may wish to consider overweighting defensives. Looking forward, accelerated monetary policy easing could be favourable for emerging market equities.
Monetary analysis suggests that the global economy will weaken into early 2025, while inflation will continue to decline. A cyclical forecasting framework, on the other hand, points to the possibility of strong economic growth in H2 2025 and 2026.
Are the two perspectives inconsistent? A reconciliation could involve downside economic and inflation surprises in H2 2024 triggering a dramatic escalation of monetary policy easing. A subsequent pick-up in money growth would lay the foundation for a H2 2025 / 2026 economic boom.
How would equities perform in this scenario? Bulls would argue that any near-term weakness due to negative economic news would be swiftly reversed as policies eased and markets shifted focus to the sunlit uplands of H2 2025 / 2026.
More likely, a significant fall in risk asset prices would be necessary to generate easing of the required speed and scale, and a subsequent recovery might take time to gather pace.
Global six-month real narrow money momentum has recovered from a major low in September 2023 but remains weak by historical standards and fell back in May – see chart 1. The assessment here is that the decline into the 2023 low will be reflected in a weakening of global economic momentum in H2 2024.
Chart 1
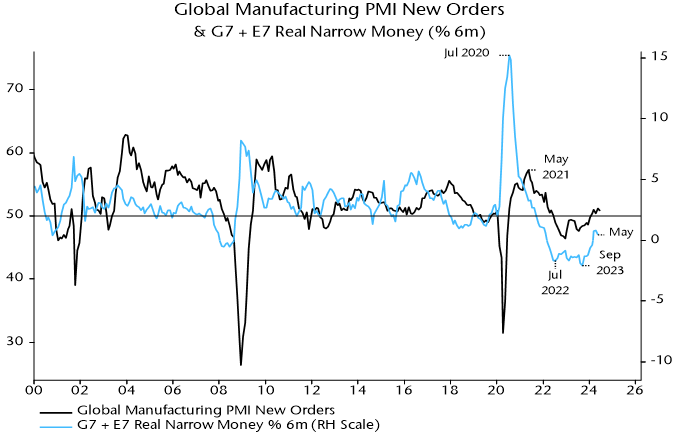
Source: LSEG Datastream. Data correct as at 4 July 2024. Past performance does not predict future returns.
A counter-argument is that a typical lead-time between lows in real money and economic momentum historically has been six to 12 months. On this basis, negative fall-out from the September 2023 real money momentum low could be reaching a maximum now, with the subsequent recovery to be reflected in economic acceleration in late 2024.
The latter interpretation is consistent with the consensus view that a sustainable economic upswing is under way and could gather pace as inflation progress allows gradual monetary policy easing.
The pessimistic view here reflects three main considerations. First, economic acceleration now would imply an absence of any negative counterpart to the September 2023 real money momentum low – historically very unusual.
Secondly, the lag between money and the economy has recently been at the top end of the historical range, suggesting that a significant portion of 2023 monetary weakness has yet to feed through.
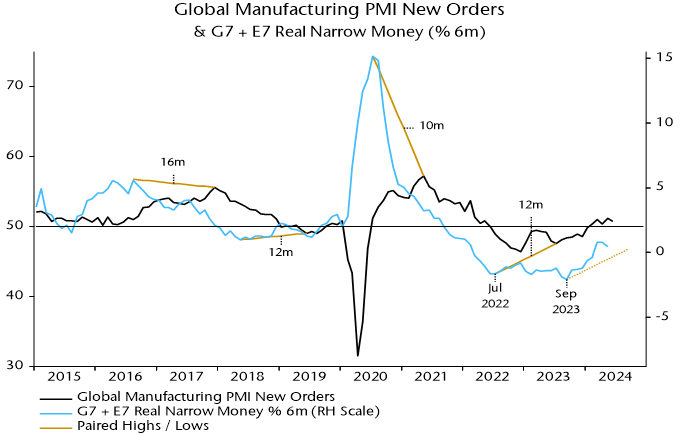
Highs in real money momentum in August 2016 and July 2020 preceded highs in global manufacturing PMI new orders by 16 and 10 months respectively, while a low in May 2018 occurred a year before a corresponding PMI trough – chart 2.
Chart 2
Source: LSEG Datastream. Data correct as at 4 July 2024. Past performance does not predict future returns.
So a PMI low associated with the September 2023 real money momentum trough could occur as late as January 2025.
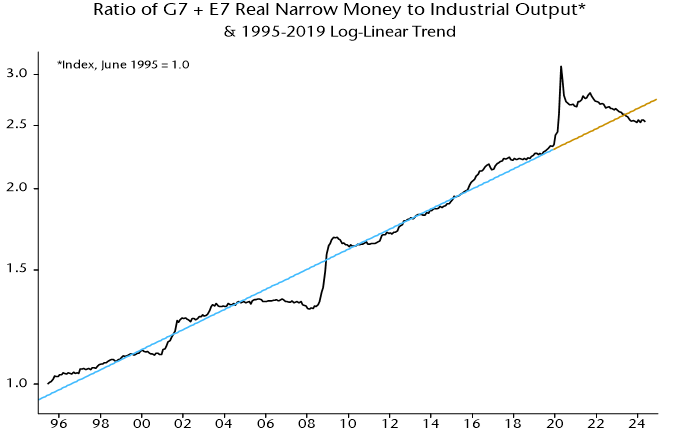
Thirdly, stock as well as flow considerations have been important for analysing the impact of money on the economy in recent years, and a current shortfall of real narrow money from its pre-pandemic trend may counteract a positive influence from the (tepid) recovery in momentum since September 2023 – chart 3.
Chart 3
Source: LSEG Datastream. Data correct as at 4 July 2024. Past performance does not predict future returns.
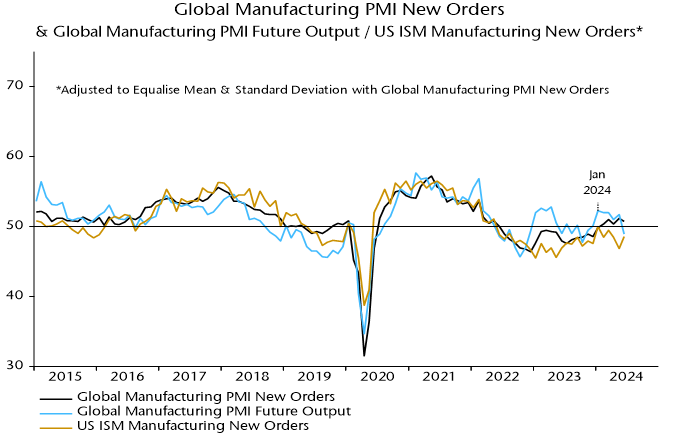
The decline in real money momentum into the September 2023 low began from a minor peak in December 2022, suggesting that the PMI – even allowing for a longer-than-normal lag – should have peaked by early 2024. Global manufacturing PMI new orders rose into March and made a marginal new high in May. However, two indicators displaying a significant contemporaneous correlation with PMI new orders historically – PMI future output and US ISM new orders – peaked in January. The future output series fell sharply in June, consistent with the view that another PMI downturn is starting – chart 4.
Chart 4
Source: LSEG Datastream. Data correct as at 4 July 2024. Past performance does not predict future returns.
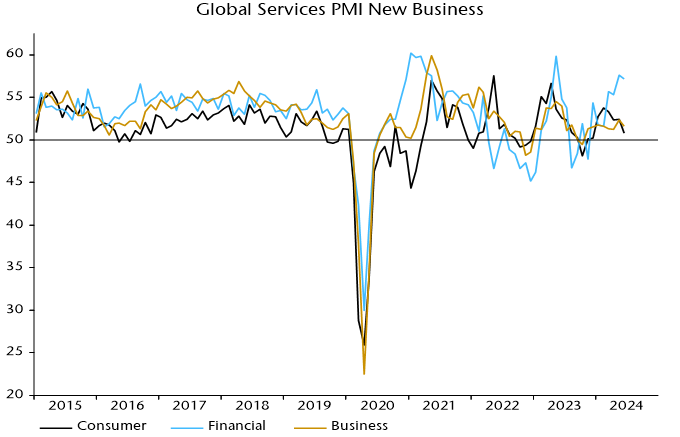
Signs of weakness are also apparent under the hood of the services PMI survey. Overall new business has been boosted by financial sector strength, reflecting buoyant markets, but the consumer services component fell to a six-month low in June – chart 5.
Chart 5
Source: LSEG Datastream. Data correct as at 4 July 2024. Past performance does not predict future returns.
Could a weakening of economic momentum in H2 2024 snowball into a deep / prolonged recession? The cycles element of the forecasting process used here suggests not.
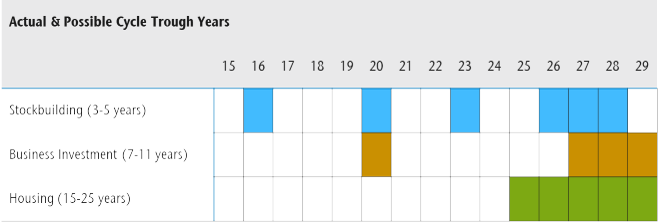
Severe / sustained recessions occur when the three investment cycles – stockbuilding, business capex and housing – move into lows simultaneously. The most recent troughs in the three cycles are judged to have occurred in Q1 2023, 2020 and 2009 respectively. Allowing for their usual lengths (3-5, 7-11 and 15-25 years), the next feasible window for simultaneous lows is 2027-28 – chart 6. Cycle influences could be positive until then.
Chart 6
Source: LSEG Datastream. Data correct as at 4 July 2024. Past performance does not predict future returns.
Major busts associated with triple-cycle lows, indeed, are usually preceded by economic booms. Such booms often involve policy shifts that super-charge positive cyclical forces. The 1987 stock market crash, for example, triggered rate cuts by the Fed and other central banks that magnified a late 1980s housing cycle peak.
Could significant policy easing in H2 2024 / H1 2025 similarly catalyse a H2 2025 / 2026 boom? Such a policy shift, on the view here, is plausible because negative economic news into early 2025 is likely to be accompanied a melting of inflation concerns.
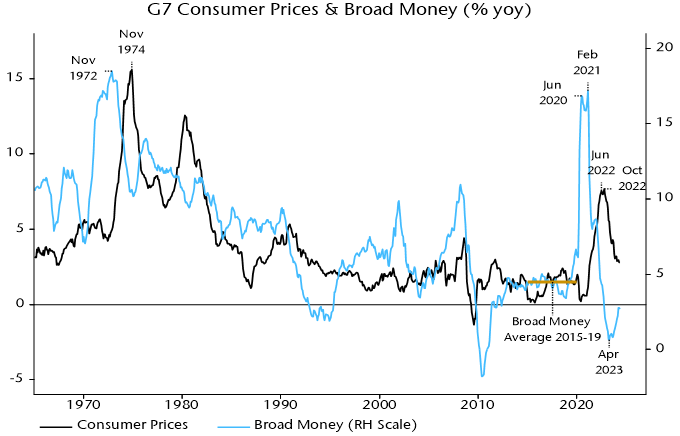
The latter suggestion is based on the monetarist rule-of-thumb that inflation follows money trends with a roughly two-year lag. G7 broad money growth of about 4.5% pa is consistent with 2% inflation. Annual growth returned to this level in mid-2022, reflected in a forecast here that inflation rates would move back to target in H2 2024 – chart 7.
Chart 7
Source: LSEG Datastream. Data correct as at 4 July 2024. Past performance does not predict future returns.
The forecast is within reach. Annual US PCE and Eurozone CPI inflation rates were 2.5% in May and June respectively, with a fall to 2% in prospect by end-Q3 on reasonable assumptions for monthly index changes. UK CPI inflation has already dropped to 2.0%.
G7 annual broad money growth continued to decline into 2023, reaching a low of 0.6% in April 2023 and recovering gradually to 2.7% in May 2024. The suggestion from the monetarist rule, therefore, is that inflation rates will move below target in H1 2025 and remain low into 2026.
Central banks have been focusing on stickier services inflation, neglecting historical evidence that services prices lag both food / energy costs and core goods prices. Those relationships, and easing wage pressures, suggest that services resilience is about to crumble, a possibility supported by a sharp drop in the global consumer services PMI output price index in June to below its pre-pandemic average – chart 8.
Chart 8

Source: LSEG Datastream. Data correct as at 4 July 2024. Past performance does not predict future returns.
The approach here uses two flow measures of global “excess” money to assess the monetary backdrop for equity markets: the gap between global six-month real narrow money and industrial output momentum, and the deviation of annual real money growth from a long-term moving average.
The two measures turned negative around end-2021, ahead of 2022 market weakness, but remained sub-zero as global indices rallied to new highs in H1 2024. The latter “miss” may be attributable to a money stock overshoot shown in chart 3 – the flow measures of excess money may have failed to capture the deployment of existing precautionary money holdings.
Still, the MSCI World index in US dollars outperformed dollar deposits by only 3.9% between end-2021 and end-June 2024, with the gain dependent on a small number of US mega-caps: the equal-weighted version of the index underperformed deposits by 8.4% over the same period.
What now? The money stock overshoot has reversed. The first excess money measure has recovered to zero but the second remains significantly negative. Mixed readings have been associated with equities underperforming deposits on average historically, with some examples of significant losses. Caution still appears warranted.
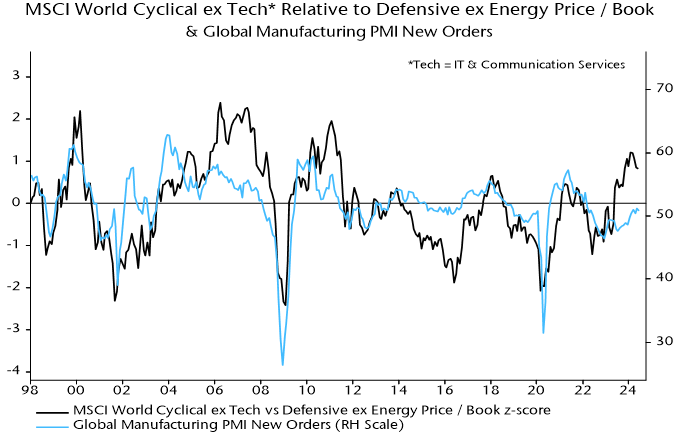
An obvious suggestion based on the economic scenario described above is to overweight defensive sectors. Non-tech cyclical sectors gave back some of their outperformance in Q2 but are still relatively expensive by historical standards, apparently discounting PMI strength – chart 9.
Chart 9
Source: LSEG Datastream. Data correct as at 4 July 2024. Past performance does not predict future returns.
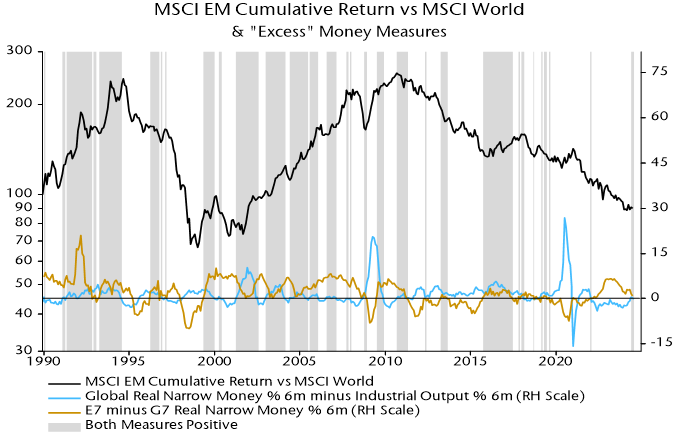
Accelerated monetary policy easing could be favourable for EM equities, especially if associated with a weaker US dollar. Monetary indicators are promising. EM equities have outperformed historically when real narrow money growth has been higher in the E7 than the G7 and the first global excess money measure has been positive – chart 10. The former condition remains in place and the second is borderline.
Chart 10
Source: LSEG Datastream. Data correct as at 4 July 2024. Past performance does not predict future returns. There is no guarantee that past trends will continue, or forecasts will be realised.